Carpatho Rusyn vs Pakistani Unemployment Among Ages 55 to 59 years
COMPARE
Carpatho Rusyn
Pakistani
Unemployment Among Ages 55 to 59 years
Unemployment Among Ages 55 to 59 years Comparison
Carpatho Rusyns
Pakistanis
4.8%
UNEMPLOYMENT AMONG AGES 55 TO 59 YEARS
66.0/ 100
METRIC RATING
157th/ 347
METRIC RANK
4.7%
UNEMPLOYMENT AMONG AGES 55 TO 59 YEARS
89.7/ 100
METRIC RATING
121st/ 347
METRIC RANK
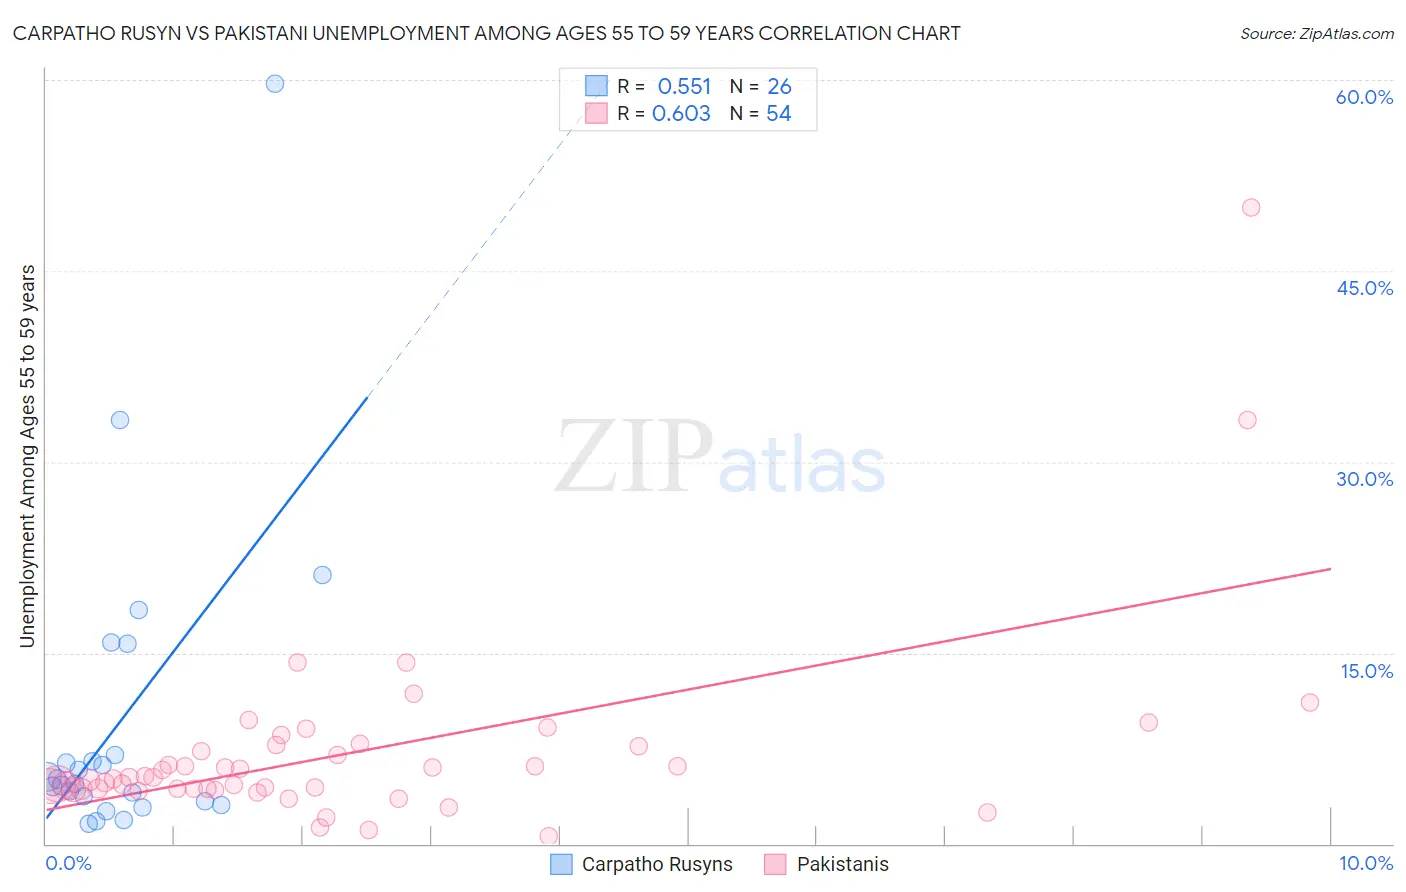
Carpatho Rusyn vs Pakistani Unemployment Among Ages 55 to 59 years Correlation Chart
The statistical analysis conducted on geographies consisting of 57,827,296 people shows a substantial positive correlation between the proportion of Carpatho Rusyns and unemployment rate among population between the ages 55 and 59 in the United States with a correlation coefficient (R) of 0.551 and weighted average of 4.8%. Similarly, the statistical analysis conducted on geographies consisting of 317,405,059 people shows a significant positive correlation between the proportion of Pakistanis and unemployment rate among population between the ages 55 and 59 in the United States with a correlation coefficient (R) of 0.603 and weighted average of 4.7%, a difference of 1.6%.
Unemployment Among Ages 55 to 59 years Correlation Summary
| Measurement | Carpatho Rusyn | Pakistani |
| Minimum | 1.5% | 0.60% |
| Maximum | 59.7% | 50.0% |
| Range | 58.2% | 49.4% |
| Mean | 9.6% | 7.1% |
| Median | 4.9% | 5.1% |
| Interquartile 25% (IQ1) | 3.3% | 4.3% |
| Interquartile 75% (IQ3) | 7.0% | 7.7% |
| Interquartile Range (IQR) | 3.7% | 3.4% |
| Standard Deviation (Sample) | 12.6% | 7.6% |
| Standard Deviation (Population) | 12.4% | 7.5% |
Similar Demographics by Unemployment Among Ages 55 to 59 years
Demographics Similar to Carpatho Rusyns by Unemployment Among Ages 55 to 59 years
In terms of unemployment among ages 55 to 59 years, the demographic groups most similar to Carpatho Rusyns are Immigrants from North Macedonia (4.8%, a difference of 0.010%), Italian (4.8%, a difference of 0.010%), Slovak (4.8%, a difference of 0.030%), Immigrants from Panama (4.8%, a difference of 0.040%), and Immigrants from Nicaragua (4.8%, a difference of 0.040%).
| Demographics | Rating | Rank | Unemployment Among Ages 55 to 59 years |
| Immigrants | Northern Africa | 69.8 /100 | #150 | Good 4.8% |
| Bahamians | 68.6 /100 | #151 | Good 4.8% |
| Laotians | 68.2 /100 | #152 | Good 4.8% |
| Immigrants | Uruguay | 67.2 /100 | #153 | Good 4.8% |
| Immigrants | Panama | 66.8 /100 | #154 | Good 4.8% |
| Immigrants | North Macedonia | 66.3 /100 | #155 | Good 4.8% |
| Italians | 66.2 /100 | #156 | Good 4.8% |
| Carpatho Rusyns | 66.0 /100 | #157 | Good 4.8% |
| Slovaks | 65.3 /100 | #158 | Good 4.8% |
| Immigrants | Nicaragua | 65.2 /100 | #159 | Good 4.8% |
| Chickasaw | 65.1 /100 | #160 | Good 4.8% |
| Koreans | 64.6 /100 | #161 | Good 4.8% |
| Immigrants | Africa | 64.2 /100 | #162 | Good 4.8% |
| Immigrants | Lebanon | 63.8 /100 | #163 | Good 4.8% |
| Americans | 63.3 /100 | #164 | Good 4.8% |
Demographics Similar to Pakistanis by Unemployment Among Ages 55 to 59 years
In terms of unemployment among ages 55 to 59 years, the demographic groups most similar to Pakistanis are Immigrants from South Africa (4.7%, a difference of 0.020%), Immigrants from Afghanistan (4.7%, a difference of 0.020%), Immigrants from Japan (4.7%, a difference of 0.030%), Lithuanian (4.7%, a difference of 0.090%), and Immigrants from Chile (4.7%, a difference of 0.12%).
| Demographics | Rating | Rank | Unemployment Among Ages 55 to 59 years |
| Bangladeshis | 91.3 /100 | #114 | Exceptional 4.7% |
| South American Indians | 90.9 /100 | #115 | Exceptional 4.7% |
| Turks | 90.9 /100 | #116 | Exceptional 4.7% |
| Asians | 90.8 /100 | #117 | Exceptional 4.7% |
| Immigrants | Chile | 90.7 /100 | #118 | Exceptional 4.7% |
| Whites/Caucasians | 90.7 /100 | #119 | Exceptional 4.7% |
| Immigrants | South Africa | 89.9 /100 | #120 | Excellent 4.7% |
| Pakistanis | 89.7 /100 | #121 | Excellent 4.7% |
| Immigrants | Afghanistan | 89.5 /100 | #122 | Excellent 4.7% |
| Immigrants | Japan | 89.4 /100 | #123 | Excellent 4.7% |
| Lithuanians | 88.8 /100 | #124 | Excellent 4.7% |
| Immigrants | Malaysia | 87.9 /100 | #125 | Excellent 4.7% |
| Immigrants | Serbia | 87.8 /100 | #126 | Excellent 4.7% |
| Icelanders | 87.7 /100 | #127 | Excellent 4.7% |
| Pennsylvania Germans | 87.1 /100 | #128 | Excellent 4.7% |