Cape Verdean vs Immigrants from Asia Unemployment Among Ages 55 to 59 years
COMPARE
Cape Verdean
Immigrants from Asia
Unemployment Among Ages 55 to 59 years
Unemployment Among Ages 55 to 59 years Comparison
Cape Verdeans
Immigrants from Asia
5.4%
UNEMPLOYMENT AMONG AGES 55 TO 59 YEARS
0.0/ 100
METRIC RATING
299th/ 347
METRIC RANK
4.8%
UNEMPLOYMENT AMONG AGES 55 TO 59 YEARS
77.8/ 100
METRIC RATING
144th/ 347
METRIC RANK
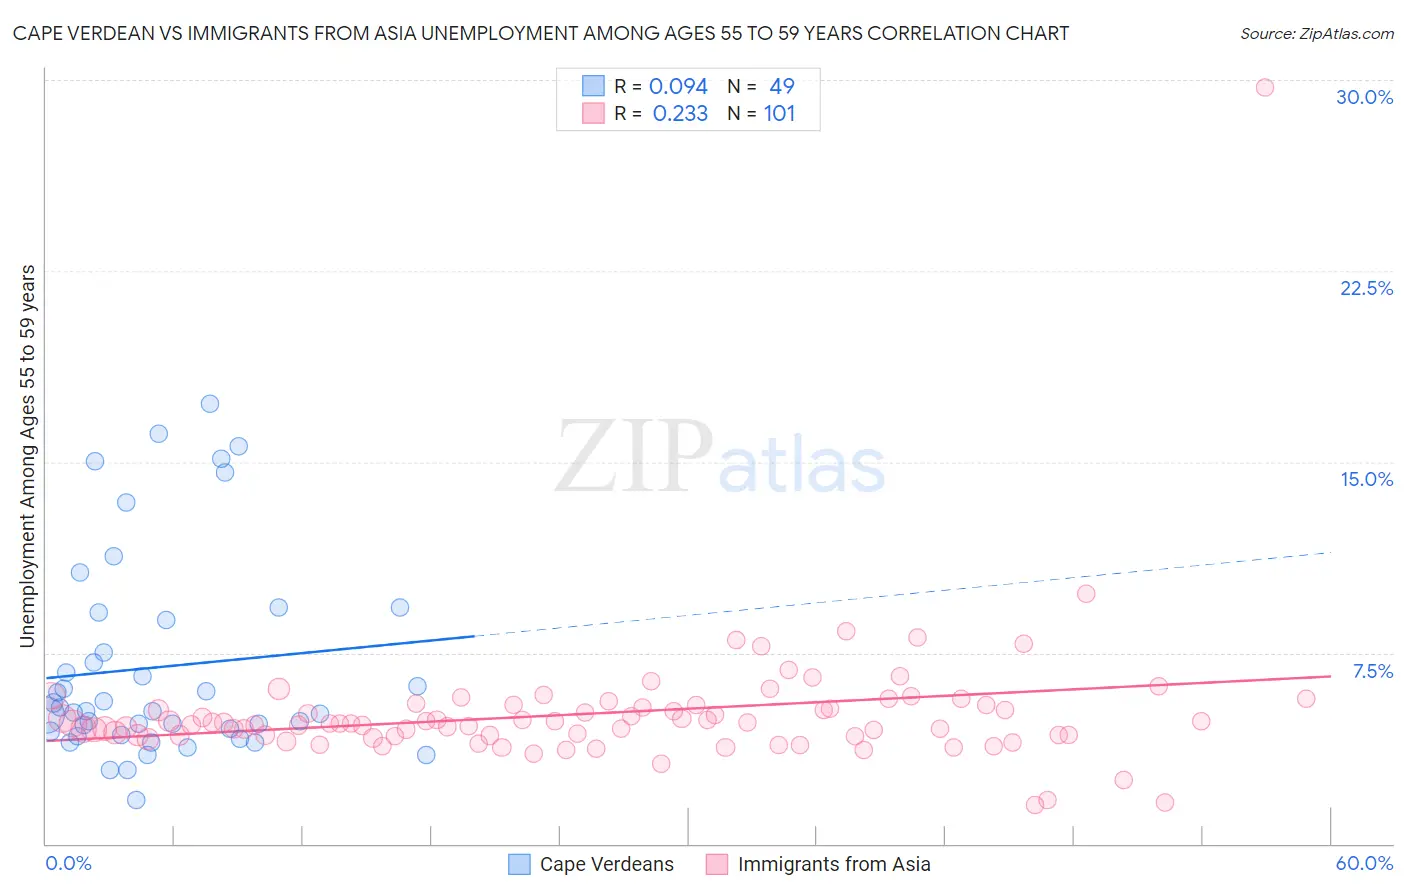
Cape Verdean vs Immigrants from Asia Unemployment Among Ages 55 to 59 years Correlation Chart
The statistical analysis conducted on geographies consisting of 105,001,365 people shows a slight positive correlation between the proportion of Cape Verdeans and unemployment rate among population between the ages 55 and 59 in the United States with a correlation coefficient (R) of 0.094 and weighted average of 5.4%. Similarly, the statistical analysis conducted on geographies consisting of 479,879,185 people shows a weak positive correlation between the proportion of Immigrants from Asia and unemployment rate among population between the ages 55 and 59 in the United States with a correlation coefficient (R) of 0.233 and weighted average of 4.8%, a difference of 14.1%.
Unemployment Among Ages 55 to 59 years Correlation Summary
| Measurement | Cape Verdean | Immigrants from Asia |
| Minimum | 1.7% | 1.5% |
| Maximum | 17.3% | 29.7% |
| Range | 15.6% | 28.2% |
| Mean | 6.9% | 5.1% |
| Median | 5.2% | 4.7% |
| Interquartile 25% (IQ1) | 4.4% | 4.3% |
| Interquartile 75% (IQ3) | 8.9% | 5.5% |
| Interquartile Range (IQR) | 4.6% | 1.2% |
| Standard Deviation (Sample) | 4.0% | 2.8% |
| Standard Deviation (Population) | 3.9% | 2.8% |
Similar Demographics by Unemployment Among Ages 55 to 59 years
Demographics Similar to Cape Verdeans by Unemployment Among Ages 55 to 59 years
In terms of unemployment among ages 55 to 59 years, the demographic groups most similar to Cape Verdeans are Immigrants from St. Vincent and the Grenadines (5.4%, a difference of 0.14%), Immigrants from Dominica (5.5%, a difference of 0.38%), Sierra Leonean (5.5%, a difference of 0.78%), Marshallese (5.5%, a difference of 0.79%), and Hispanic or Latino (5.4%, a difference of 1.2%).
| Demographics | Rating | Rank | Unemployment Among Ages 55 to 59 years |
| British West Indians | 0.0 /100 | #292 | Tragic 5.3% |
| Immigrants | Grenada | 0.0 /100 | #293 | Tragic 5.3% |
| Cajuns | 0.0 /100 | #294 | Tragic 5.3% |
| Dutch West Indians | 0.0 /100 | #295 | Tragic 5.3% |
| Barbadians | 0.0 /100 | #296 | Tragic 5.3% |
| Immigrants | Mexico | 0.0 /100 | #297 | Tragic 5.3% |
| Hispanics or Latinos | 0.0 /100 | #298 | Tragic 5.4% |
| Cape Verdeans | 0.0 /100 | #299 | Tragic 5.4% |
| Immigrants | St. Vincent and the Grenadines | 0.0 /100 | #300 | Tragic 5.4% |
| Immigrants | Dominica | 0.0 /100 | #301 | Tragic 5.5% |
| Sierra Leoneans | 0.0 /100 | #302 | Tragic 5.5% |
| Marshallese | 0.0 /100 | #303 | Tragic 5.5% |
| Blacks/African Americans | 0.0 /100 | #304 | Tragic 5.5% |
| Immigrants | Portugal | 0.0 /100 | #305 | Tragic 5.5% |
| Immigrants | Cabo Verde | 0.0 /100 | #306 | Tragic 5.5% |
Demographics Similar to Immigrants from Asia by Unemployment Among Ages 55 to 59 years
In terms of unemployment among ages 55 to 59 years, the demographic groups most similar to Immigrants from Asia are Immigrants from Northern Europe (4.8%, a difference of 0.020%), Immigrants from South Eastern Asia (4.8%, a difference of 0.020%), Ukrainian (4.8%, a difference of 0.050%), Immigrants from Singapore (4.8%, a difference of 0.070%), and Immigrants from Norway (4.8%, a difference of 0.12%).
| Demographics | Rating | Rank | Unemployment Among Ages 55 to 59 years |
| Delaware | 83.6 /100 | #137 | Excellent 4.7% |
| Immigrants | Switzerland | 82.9 /100 | #138 | Excellent 4.7% |
| Romanians | 82.7 /100 | #139 | Excellent 4.7% |
| Immigrants | Indonesia | 80.2 /100 | #140 | Excellent 4.8% |
| French Canadians | 80.1 /100 | #141 | Excellent 4.8% |
| Immigrants | Norway | 79.8 /100 | #142 | Good 4.8% |
| Ukrainians | 78.6 /100 | #143 | Good 4.8% |
| Immigrants | Asia | 77.8 /100 | #144 | Good 4.8% |
| Immigrants | Northern Europe | 77.5 /100 | #145 | Good 4.8% |
| Immigrants | South Eastern Asia | 77.4 /100 | #146 | Good 4.8% |
| Immigrants | Singapore | 76.6 /100 | #147 | Good 4.8% |
| Immigrants | Bahamas | 71.8 /100 | #148 | Good 4.8% |
| Immigrants | Lithuania | 70.8 /100 | #149 | Good 4.8% |
| Immigrants | Northern Africa | 69.8 /100 | #150 | Good 4.8% |
| Bahamians | 68.6 /100 | #151 | Good 4.8% |