Canadian vs Chilean Unemployment Among Seniors over 65 years
COMPARE
Canadian
Chilean
Unemployment Among Seniors over 65 years
Unemployment Among Seniors over 65 years Comparison
Canadians
Chileans
5.1%
UNEMPLOYMENT AMONG SENIORS OVER 65 YEARS
74.7/ 100
METRIC RATING
152nd/ 347
METRIC RANK
5.1%
UNEMPLOYMENT AMONG SENIORS OVER 65 YEARS
85.6/ 100
METRIC RATING
132nd/ 347
METRIC RANK
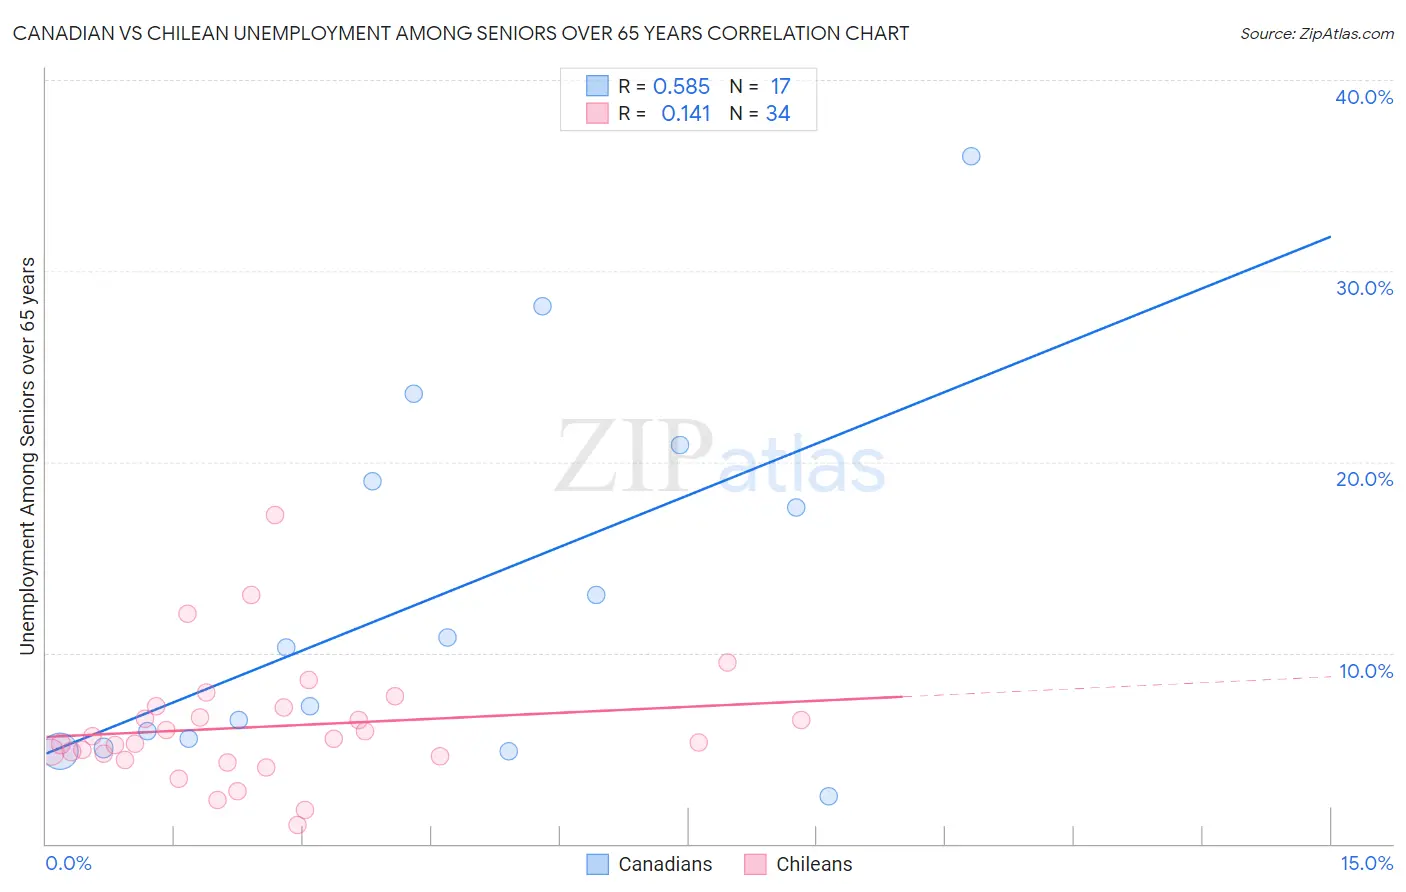
Canadian vs Chilean Unemployment Among Seniors over 65 years Correlation Chart
The statistical analysis conducted on geographies consisting of 385,292,194 people shows a substantial positive correlation between the proportion of Canadians and unemployment rate amomg seniors over the age of 65 in the United States with a correlation coefficient (R) of 0.585 and weighted average of 5.1%. Similarly, the statistical analysis conducted on geographies consisting of 242,211,258 people shows a poor positive correlation between the proportion of Chileans and unemployment rate amomg seniors over the age of 65 in the United States with a correlation coefficient (R) of 0.141 and weighted average of 5.1%, a difference of 0.57%.
Unemployment Among Seniors over 65 years Correlation Summary
| Measurement | Canadian | Chilean |
| Minimum | 2.5% | 1.0% |
| Maximum | 36.0% | 17.2% |
| Range | 33.5% | 16.2% |
| Mean | 13.0% | 6.1% |
| Median | 10.3% | 5.4% |
| Interquartile 25% (IQ1) | 5.2% | 4.6% |
| Interquartile 75% (IQ3) | 19.9% | 7.1% |
| Interquartile Range (IQR) | 14.7% | 2.5% |
| Standard Deviation (Sample) | 9.7% | 3.2% |
| Standard Deviation (Population) | 9.4% | 3.1% |
Demographics Similar to Canadians and Chileans by Unemployment Among Seniors over 65 years
In terms of unemployment among seniors over 65 years, the demographic groups most similar to Canadians are Pakistani (5.1%, a difference of 0.030%), Immigrants from Asia (5.1%, a difference of 0.040%), Immigrants from Afghanistan (5.1%, a difference of 0.090%), Greek (5.1%, a difference of 0.10%), and Slovak (5.1%, a difference of 0.14%). Similarly, the demographic groups most similar to Chileans are Syrian (5.1%, a difference of 0.020%), Turkish (5.1%, a difference of 0.050%), Ukrainian (5.1%, a difference of 0.070%), White/Caucasian (5.1%, a difference of 0.080%), and Arab (5.1%, a difference of 0.080%).
| Demographics | Rating | Rank | Unemployment Among Seniors over 65 years |
| Chileans | 85.6 /100 | #132 | Excellent 5.1% |
| Syrians | 85.3 /100 | #133 | Excellent 5.1% |
| Turks | 84.9 /100 | #134 | Excellent 5.1% |
| Ukrainians | 84.4 /100 | #135 | Excellent 5.1% |
| Whites/Caucasians | 84.4 /100 | #136 | Excellent 5.1% |
| Arabs | 84.3 /100 | #137 | Excellent 5.1% |
| New Zealanders | 83.2 /100 | #138 | Excellent 5.1% |
| Immigrants | Panama | 83.0 /100 | #139 | Excellent 5.1% |
| Immigrants | Chile | 83.0 /100 | #140 | Excellent 5.1% |
| Cherokee | 81.6 /100 | #141 | Excellent 5.1% |
| Immigrants | Indonesia | 81.0 /100 | #142 | Excellent 5.1% |
| Senegalese | 80.4 /100 | #143 | Excellent 5.1% |
| Poles | 80.3 /100 | #144 | Excellent 5.1% |
| Spanish | 78.8 /100 | #145 | Good 5.1% |
| Immigrants | Russia | 78.5 /100 | #146 | Good 5.1% |
| Slovaks | 77.9 /100 | #147 | Good 5.1% |
| Greeks | 77.0 /100 | #148 | Good 5.1% |
| Immigrants | Afghanistan | 76.8 /100 | #149 | Good 5.1% |
| Immigrants | Asia | 75.6 /100 | #150 | Good 5.1% |
| Pakistanis | 75.5 /100 | #151 | Good 5.1% |
| Canadians | 74.7 /100 | #152 | Good 5.1% |