Cambodian vs Zimbabwean Unemployment Among Ages 35 to 44 years
COMPARE
Cambodian
Zimbabwean
Unemployment Among Ages 35 to 44 years
Unemployment Among Ages 35 to 44 years Comparison
Cambodians
Zimbabweans
4.4%
UNEMPLOYMENT AMONG AGES 35 TO 44 YEARS
97.0/ 100
METRIC RATING
65th/ 347
METRIC RANK
4.3%
UNEMPLOYMENT AMONG AGES 35 TO 44 YEARS
98.8/ 100
METRIC RATING
40th/ 347
METRIC RANK
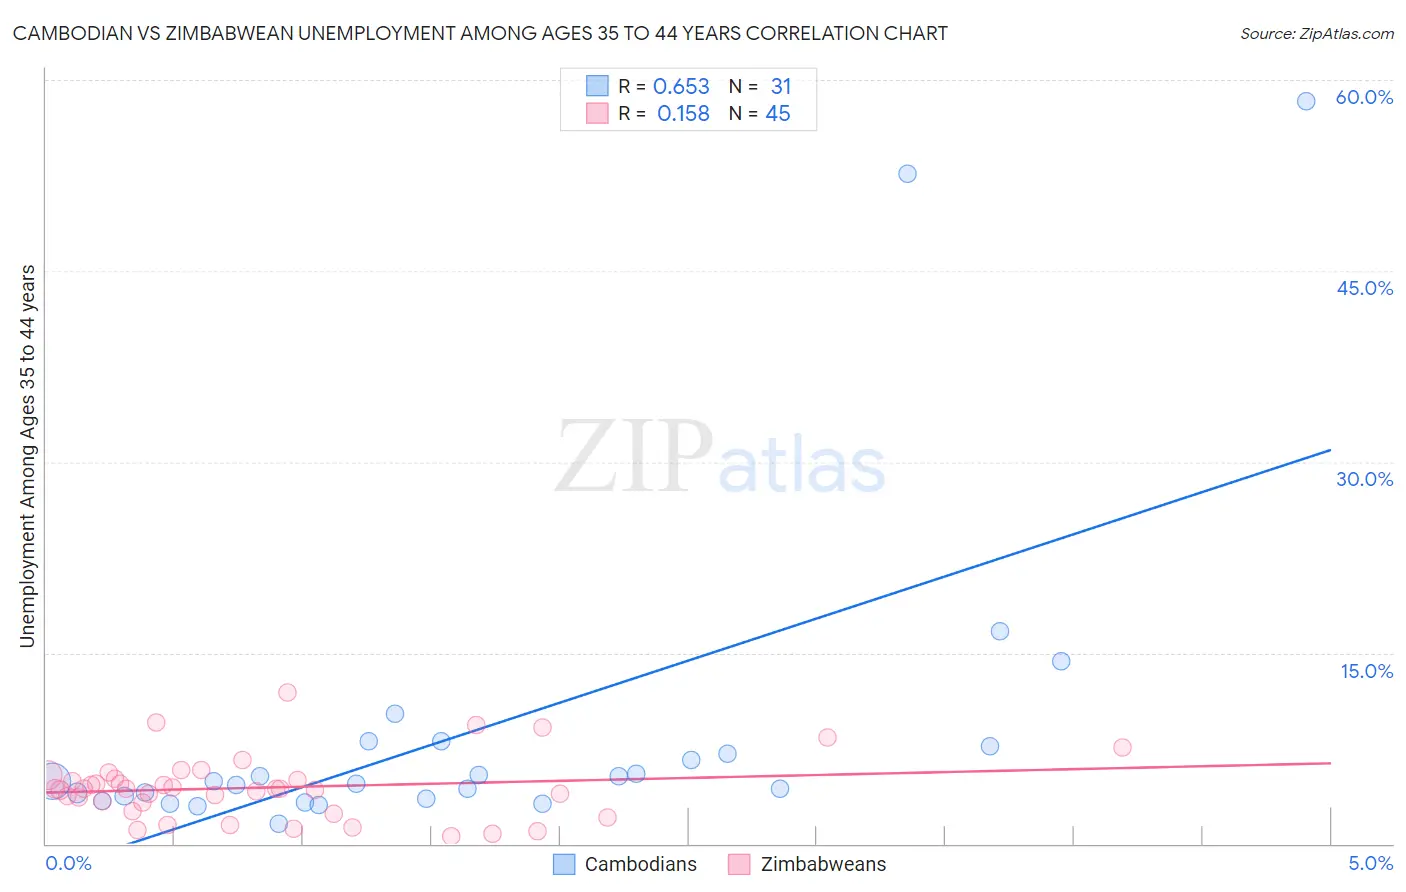
Cambodian vs Zimbabwean Unemployment Among Ages 35 to 44 years Correlation Chart
The statistical analysis conducted on geographies consisting of 102,040,084 people shows a significant positive correlation between the proportion of Cambodians and unemployment rate among population between the ages 35 and 44 in the United States with a correlation coefficient (R) of 0.653 and weighted average of 4.4%. Similarly, the statistical analysis conducted on geographies consisting of 68,932,734 people shows a poor positive correlation between the proportion of Zimbabweans and unemployment rate among population between the ages 35 and 44 in the United States with a correlation coefficient (R) of 0.158 and weighted average of 4.3%, a difference of 1.8%.
Unemployment Among Ages 35 to 44 years Correlation Summary
| Measurement | Cambodian | Zimbabwean |
| Minimum | 1.6% | 0.60% |
| Maximum | 58.3% | 11.9% |
| Range | 56.7% | 11.3% |
| Mean | 8.9% | 4.4% |
| Median | 4.9% | 4.3% |
| Interquartile 25% (IQ1) | 3.5% | 2.9% |
| Interquartile 75% (IQ3) | 7.7% | 5.2% |
| Interquartile Range (IQR) | 4.2% | 2.3% |
| Standard Deviation (Sample) | 12.9% | 2.5% |
| Standard Deviation (Population) | 12.7% | 2.4% |
Similar Demographics by Unemployment Among Ages 35 to 44 years
Demographics Similar to Cambodians by Unemployment Among Ages 35 to 44 years
In terms of unemployment among ages 35 to 44 years, the demographic groups most similar to Cambodians are Immigrants from Serbia (4.4%, a difference of 0.040%), Austrian (4.4%, a difference of 0.060%), Croatian (4.4%, a difference of 0.070%), Immigrants from Bulgaria (4.4%, a difference of 0.070%), and Taiwanese (4.4%, a difference of 0.080%).
| Demographics | Rating | Rank | Unemployment Among Ages 35 to 44 years |
| English | 97.2 /100 | #58 | Exceptional 4.4% |
| Greeks | 97.1 /100 | #59 | Exceptional 4.4% |
| Taiwanese | 97.1 /100 | #60 | Exceptional 4.4% |
| Croatians | 97.1 /100 | #61 | Exceptional 4.4% |
| Immigrants | Bulgaria | 97.1 /100 | #62 | Exceptional 4.4% |
| Austrians | 97.1 /100 | #63 | Exceptional 4.4% |
| Immigrants | Serbia | 97.0 /100 | #64 | Exceptional 4.4% |
| Cambodians | 97.0 /100 | #65 | Exceptional 4.4% |
| Icelanders | 96.8 /100 | #66 | Exceptional 4.4% |
| Argentineans | 96.8 /100 | #67 | Exceptional 4.4% |
| Immigrants | Ireland | 96.8 /100 | #68 | Exceptional 4.4% |
| Slovenes | 96.7 /100 | #69 | Exceptional 4.4% |
| Immigrants | China | 96.7 /100 | #70 | Exceptional 4.4% |
| Immigrants | Lithuania | 96.7 /100 | #71 | Exceptional 4.4% |
| Northern Europeans | 96.5 /100 | #72 | Exceptional 4.4% |
Demographics Similar to Zimbabweans by Unemployment Among Ages 35 to 44 years
In terms of unemployment among ages 35 to 44 years, the demographic groups most similar to Zimbabweans are Palestinian (4.3%, a difference of 0.060%), Belgian (4.3%, a difference of 0.10%), Burmese (4.3%, a difference of 0.11%), German (4.3%, a difference of 0.11%), and Immigrants from Zimbabwe (4.3%, a difference of 0.18%).
| Demographics | Rating | Rank | Unemployment Among Ages 35 to 44 years |
| Immigrants | Sri Lanka | 99.1 /100 | #33 | Exceptional 4.3% |
| Jordanians | 99.0 /100 | #34 | Exceptional 4.3% |
| Luxembourgers | 99.0 /100 | #35 | Exceptional 4.3% |
| Mongolians | 98.9 /100 | #36 | Exceptional 4.3% |
| Immigrants | Zimbabwe | 98.9 /100 | #37 | Exceptional 4.3% |
| Burmese | 98.9 /100 | #38 | Exceptional 4.3% |
| Palestinians | 98.8 /100 | #39 | Exceptional 4.3% |
| Zimbabweans | 98.8 /100 | #40 | Exceptional 4.3% |
| Belgians | 98.7 /100 | #41 | Exceptional 4.3% |
| Germans | 98.7 /100 | #42 | Exceptional 4.3% |
| Eastern Europeans | 98.7 /100 | #43 | Exceptional 4.3% |
| Immigrants | Malaysia | 98.7 /100 | #44 | Exceptional 4.3% |
| Immigrants | Korea | 98.4 /100 | #45 | Exceptional 4.3% |
| Immigrants | Belgium | 98.4 /100 | #46 | Exceptional 4.3% |
| British | 98.3 /100 | #47 | Exceptional 4.4% |