Cambodian vs Immigrants from Sudan Unemployment Among Seniors over 65 years
COMPARE
Cambodian
Immigrants from Sudan
Unemployment Among Seniors over 65 years
Unemployment Among Seniors over 65 years Comparison
Cambodians
Immigrants from Sudan
4.8%
UNEMPLOYMENT AMONG SENIORS OVER 65 YEARS
100.0/ 100
METRIC RATING
36th/ 347
METRIC RANK
4.9%
UNEMPLOYMENT AMONG SENIORS OVER 65 YEARS
99.8/ 100
METRIC RATING
53rd/ 347
METRIC RANK
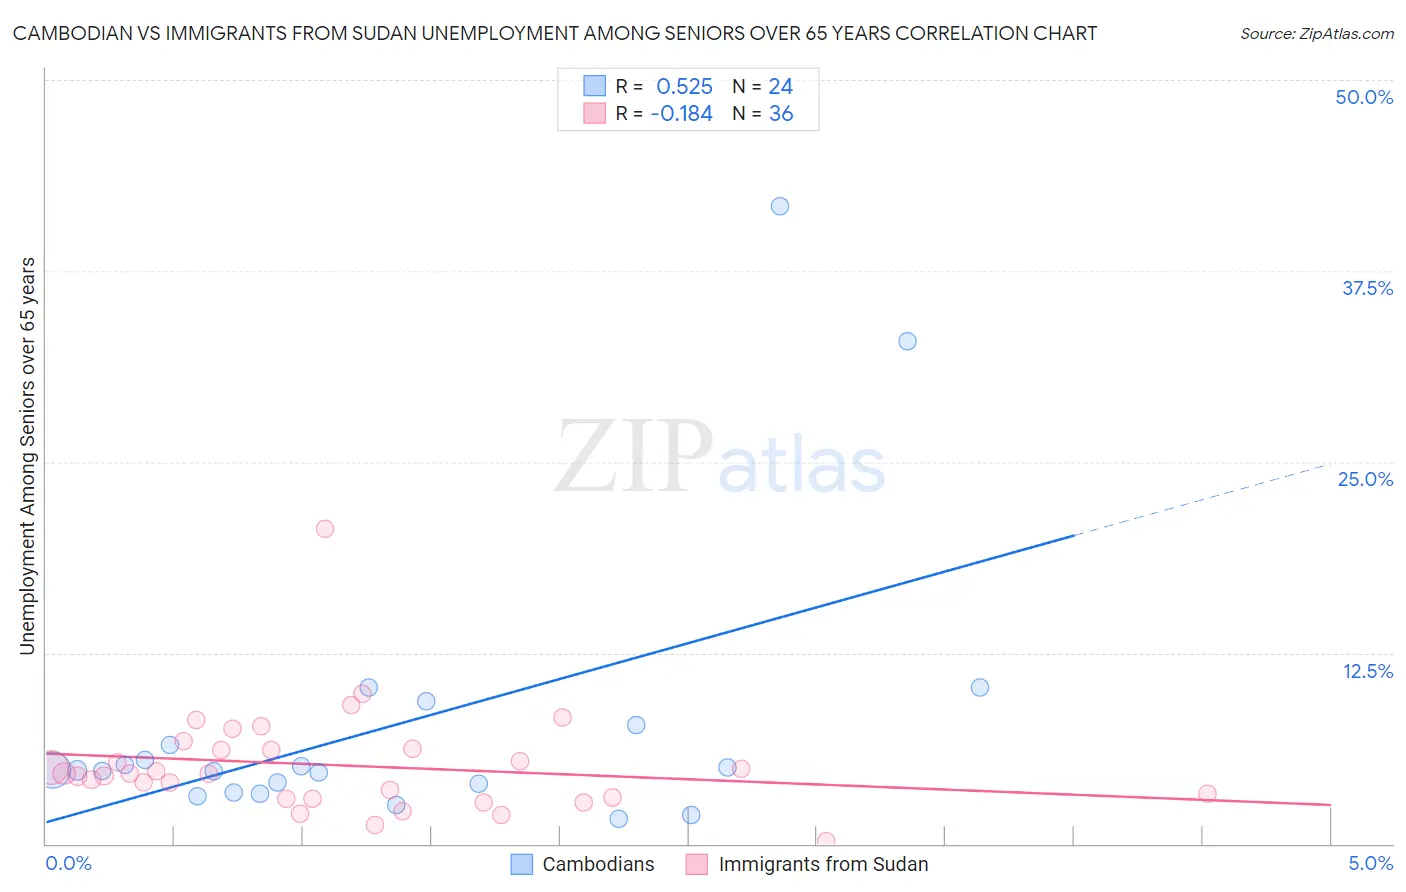
Cambodian vs Immigrants from Sudan Unemployment Among Seniors over 65 years Correlation Chart
The statistical analysis conducted on geographies consisting of 99,515,098 people shows a substantial positive correlation between the proportion of Cambodians and unemployment rate amomg seniors over the age of 65 in the United States with a correlation coefficient (R) of 0.525 and weighted average of 4.8%. Similarly, the statistical analysis conducted on geographies consisting of 114,887,010 people shows a poor negative correlation between the proportion of Immigrants from Sudan and unemployment rate amomg seniors over the age of 65 in the United States with a correlation coefficient (R) of -0.184 and weighted average of 4.9%, a difference of 0.99%.
Unemployment Among Seniors over 65 years Correlation Summary
| Measurement | Cambodian | Immigrants from Sudan |
| Minimum | 1.6% | 0.20% |
| Maximum | 41.7% | 20.6% |
| Range | 40.1% | 20.4% |
| Mean | 7.8% | 5.1% |
| Median | 4.8% | 4.6% |
| Interquartile 25% (IQ1) | 3.6% | 3.0% |
| Interquartile 75% (IQ3) | 7.1% | 6.2% |
| Interquartile Range (IQR) | 3.5% | 3.2% |
| Standard Deviation (Sample) | 9.5% | 3.5% |
| Standard Deviation (Population) | 9.3% | 3.4% |
Demographics Similar to Cambodians and Immigrants from Sudan by Unemployment Among Seniors over 65 years
In terms of unemployment among seniors over 65 years, the demographic groups most similar to Cambodians are Bulgarian (4.8%, a difference of 0.020%), Immigrants from India (4.8%, a difference of 0.080%), Macedonian (4.8%, a difference of 0.11%), Immigrants from Kuwait (4.8%, a difference of 0.14%), and Bhutanese (4.8%, a difference of 0.15%). Similarly, the demographic groups most similar to Immigrants from Sudan are Swedish (4.9%, a difference of 0.040%), Scotch-Irish (4.9%, a difference of 0.060%), Immigrants from Iraq (4.9%, a difference of 0.060%), Immigrants from Austria (4.9%, a difference of 0.18%), and Immigrants from Kenya (4.9%, a difference of 0.19%).
| Demographics | Rating | Rank | Unemployment Among Seniors over 65 years |
| Bhutanese | 100.0 /100 | #34 | Exceptional 4.8% |
| Immigrants | Kuwait | 100.0 /100 | #35 | Exceptional 4.8% |
| Cambodians | 100.0 /100 | #36 | Exceptional 4.8% |
| Bulgarians | 99.9 /100 | #37 | Exceptional 4.8% |
| Immigrants | India | 99.9 /100 | #38 | Exceptional 4.8% |
| Macedonians | 99.9 /100 | #39 | Exceptional 4.8% |
| Immigrants | Sweden | 99.9 /100 | #40 | Exceptional 4.8% |
| Kiowa | 99.9 /100 | #41 | Exceptional 4.8% |
| Swiss | 99.9 /100 | #42 | Exceptional 4.8% |
| Luxembourgers | 99.9 /100 | #43 | Exceptional 4.8% |
| Jordanians | 99.9 /100 | #44 | Exceptional 4.9% |
| Ethiopians | 99.9 /100 | #45 | Exceptional 4.9% |
| Immigrants | Jordan | 99.9 /100 | #46 | Exceptional 4.9% |
| Germans | 99.9 /100 | #47 | Exceptional 4.9% |
| Choctaw | 99.9 /100 | #48 | Exceptional 4.9% |
| Immigrants | Kenya | 99.9 /100 | #49 | Exceptional 4.9% |
| Immigrants | Austria | 99.9 /100 | #50 | Exceptional 4.9% |
| Scotch-Irish | 99.9 /100 | #51 | Exceptional 4.9% |
| Swedes | 99.9 /100 | #52 | Exceptional 4.9% |
| Immigrants | Sudan | 99.8 /100 | #53 | Exceptional 4.9% |
| Immigrants | Iraq | 99.8 /100 | #54 | Exceptional 4.9% |