Cajun vs Native Hawaiian Unemployment Among Ages 16 to 19 years
COMPARE
Cajun
Native Hawaiian
Unemployment Among Ages 16 to 19 years
Unemployment Among Ages 16 to 19 years Comparison
Cajuns
Native Hawaiians
19.6%
UNEMPLOYMENT AMONG AGES 16 TO 19 YEARS
0.0/ 100
METRIC RATING
280th/ 347
METRIC RANK
18.3%
UNEMPLOYMENT AMONG AGES 16 TO 19 YEARS
2.4/ 100
METRIC RATING
239th/ 347
METRIC RANK
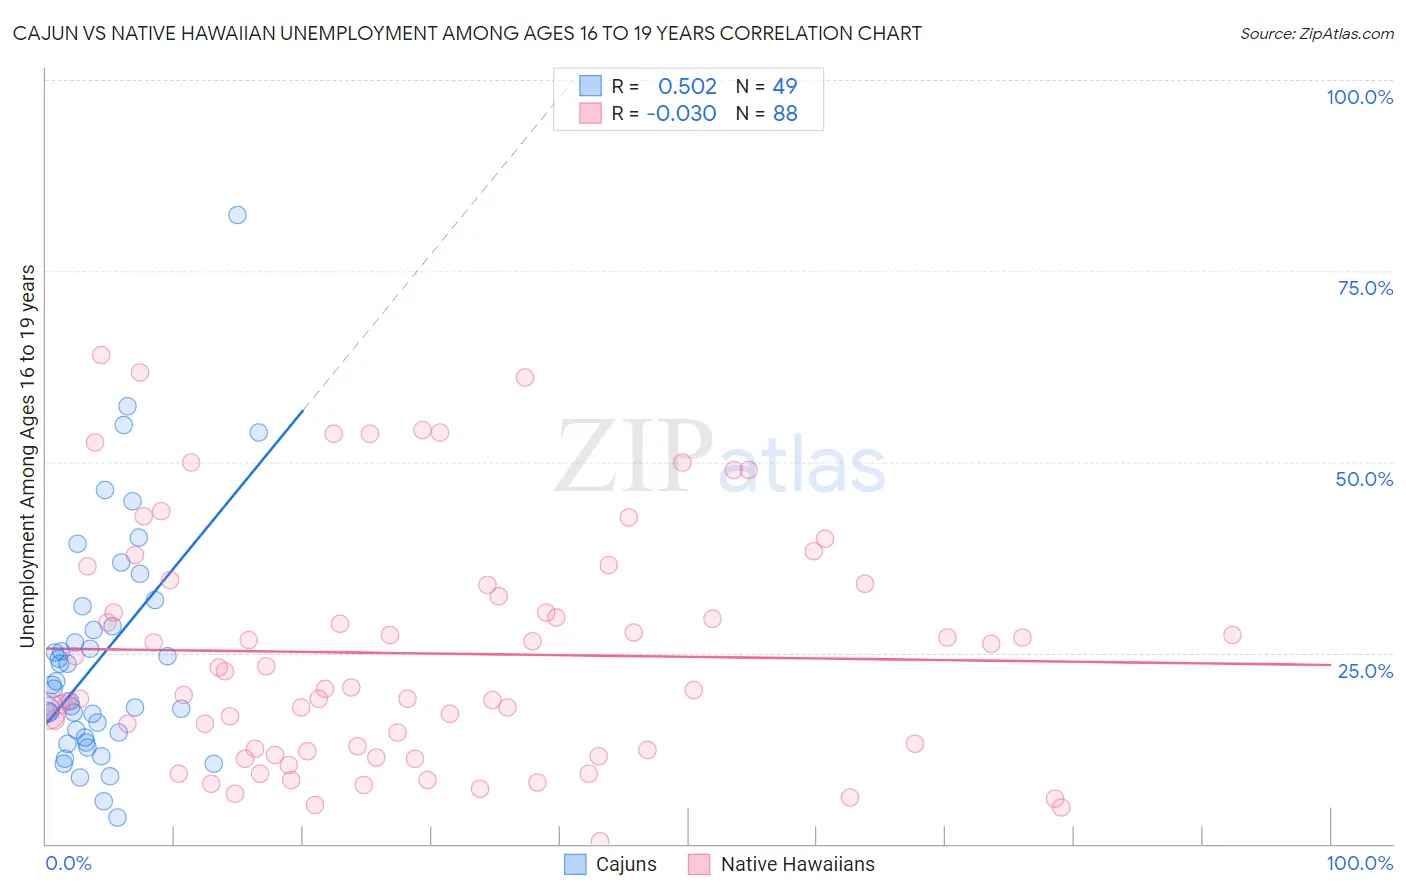
Cajun vs Native Hawaiian Unemployment Among Ages 16 to 19 years Correlation Chart
The statistical analysis conducted on geographies consisting of 144,853,466 people shows a substantial positive correlation between the proportion of Cajuns and unemployment rate among population between the ages 16 and 19 in the United States with a correlation coefficient (R) of 0.502 and weighted average of 19.6%. Similarly, the statistical analysis conducted on geographies consisting of 318,420,829 people shows no correlation between the proportion of Native Hawaiians and unemployment rate among population between the ages 16 and 19 in the United States with a correlation coefficient (R) of -0.030 and weighted average of 18.3%, a difference of 6.8%.
Unemployment Among Ages 16 to 19 years Correlation Summary
| Measurement | Cajun | Native Hawaiian |
| Minimum | 3.4% | 0.40% |
| Maximum | 82.4% | 63.9% |
| Range | 79.0% | 63.5% |
| Mean | 24.4% | 24.9% |
| Median | 20.3% | 20.4% |
| Interquartile 25% (IQ1) | 14.3% | 12.2% |
| Interquartile 75% (IQ3) | 29.7% | 34.0% |
| Interquartile Range (IQR) | 15.5% | 21.8% |
| Standard Deviation (Sample) | 15.3% | 15.5% |
| Standard Deviation (Population) | 15.2% | 15.4% |
Similar Demographics by Unemployment Among Ages 16 to 19 years
Demographics Similar to Cajuns by Unemployment Among Ages 16 to 19 years
In terms of unemployment among ages 16 to 19 years, the demographic groups most similar to Cajuns are Ute (19.6%, a difference of 0.12%), Cypriot (19.6%, a difference of 0.17%), African (19.5%, a difference of 0.49%), Dutch West Indian (19.7%, a difference of 0.62%), and Sioux (19.7%, a difference of 0.67%).
| Demographics | Rating | Rank | Unemployment Among Ages 16 to 19 years |
| Immigrants | Panama | 0.0 /100 | #273 | Tragic 19.3% |
| Shoshone | 0.0 /100 | #274 | Tragic 19.3% |
| Paraguayans | 0.0 /100 | #275 | Tragic 19.4% |
| Immigrants | Latin America | 0.0 /100 | #276 | Tragic 19.4% |
| Immigrants | Western Africa | 0.0 /100 | #277 | Tragic 19.4% |
| Africans | 0.0 /100 | #278 | Tragic 19.5% |
| Ute | 0.0 /100 | #279 | Tragic 19.6% |
| Cajuns | 0.0 /100 | #280 | Tragic 19.6% |
| Cypriots | 0.0 /100 | #281 | Tragic 19.6% |
| Dutch West Indians | 0.0 /100 | #282 | Tragic 19.7% |
| Sioux | 0.0 /100 | #283 | Tragic 19.7% |
| Sierra Leoneans | 0.0 /100 | #284 | Tragic 19.7% |
| Ghanaians | 0.0 /100 | #285 | Tragic 19.8% |
| Bahamians | 0.0 /100 | #286 | Tragic 19.8% |
| Immigrants | Ghana | 0.0 /100 | #287 | Tragic 19.8% |
Demographics Similar to Native Hawaiians by Unemployment Among Ages 16 to 19 years
In terms of unemployment among ages 16 to 19 years, the demographic groups most similar to Native Hawaiians are South American (18.3%, a difference of 0.080%), Immigrants (18.3%, a difference of 0.10%), Immigrants from Colombia (18.3%, a difference of 0.11%), French American Indian (18.3%, a difference of 0.19%), and Immigrants from Cabo Verde (18.4%, a difference of 0.22%).
| Demographics | Rating | Rank | Unemployment Among Ages 16 to 19 years |
| Immigrants | Russia | 4.0 /100 | #232 | Tragic 18.2% |
| Seminole | 4.0 /100 | #233 | Tragic 18.2% |
| Colombians | 3.7 /100 | #234 | Tragic 18.3% |
| French American Indians | 2.9 /100 | #235 | Tragic 18.3% |
| Immigrants | Colombia | 2.7 /100 | #236 | Tragic 18.3% |
| Immigrants | Immigrants | 2.7 /100 | #237 | Tragic 18.3% |
| South Americans | 2.6 /100 | #238 | Tragic 18.3% |
| Native Hawaiians | 2.4 /100 | #239 | Tragic 18.3% |
| Immigrants | Cabo Verde | 2.0 /100 | #240 | Tragic 18.4% |
| Immigrants | Ukraine | 1.3 /100 | #241 | Tragic 18.5% |
| Moroccans | 1.1 /100 | #242 | Tragic 18.5% |
| Mexicans | 0.9 /100 | #243 | Tragic 18.5% |
| Guatemalans | 0.8 /100 | #244 | Tragic 18.6% |
| Immigrants | Belarus | 0.8 /100 | #245 | Tragic 18.6% |
| Immigrants | South America | 0.5 /100 | #246 | Tragic 18.7% |