Cajun vs Immigrants from Eritrea Unemployment Among Ages 55 to 59 years
COMPARE
Cajun
Immigrants from Eritrea
Unemployment Among Ages 55 to 59 years
Unemployment Among Ages 55 to 59 years Comparison
Cajuns
Immigrants from Eritrea
5.3%
UNEMPLOYMENT AMONG AGES 55 TO 59 YEARS
0.0/ 100
METRIC RATING
294th/ 347
METRIC RANK
4.4%
UNEMPLOYMENT AMONG AGES 55 TO 59 YEARS
100.0/ 100
METRIC RATING
25th/ 347
METRIC RANK
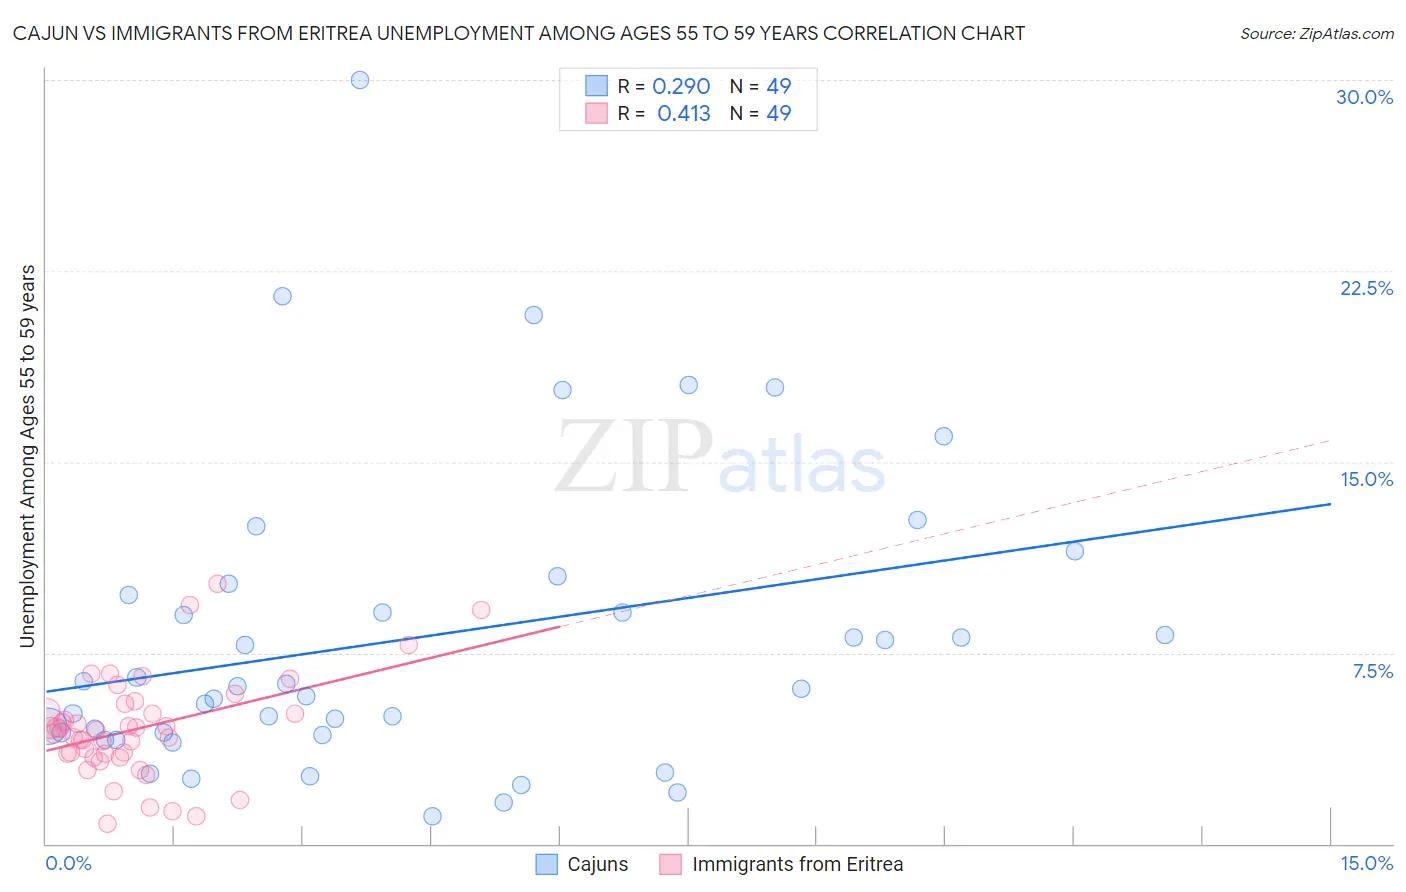
Cajun vs Immigrants from Eritrea Unemployment Among Ages 55 to 59 years Correlation Chart
The statistical analysis conducted on geographies consisting of 141,735,204 people shows a weak positive correlation between the proportion of Cajuns and unemployment rate among population between the ages 55 and 59 in the United States with a correlation coefficient (R) of 0.290 and weighted average of 5.3%. Similarly, the statistical analysis conducted on geographies consisting of 103,259,839 people shows a moderate positive correlation between the proportion of Immigrants from Eritrea and unemployment rate among population between the ages 55 and 59 in the United States with a correlation coefficient (R) of 0.413 and weighted average of 4.4%, a difference of 19.8%.
Unemployment Among Ages 55 to 59 years Correlation Summary
| Measurement | Cajun | Immigrants from Eritrea |
| Minimum | 1.1% | 0.80% |
| Maximum | 30.0% | 10.2% |
| Range | 28.9% | 9.4% |
| Mean | 8.1% | 4.5% |
| Median | 6.2% | 4.5% |
| Interquartile 25% (IQ1) | 4.3% | 3.5% |
| Interquartile 75% (IQ3) | 10.0% | 5.3% |
| Interquartile Range (IQR) | 5.7% | 1.9% |
| Standard Deviation (Sample) | 6.0% | 2.0% |
| Standard Deviation (Population) | 5.9% | 2.0% |
Similar Demographics by Unemployment Among Ages 55 to 59 years
Demographics Similar to Cajuns by Unemployment Among Ages 55 to 59 years
In terms of unemployment among ages 55 to 59 years, the demographic groups most similar to Cajuns are Immigrants from Grenada (5.3%, a difference of 0.12%), Dutch West Indian (5.3%, a difference of 0.12%), Barbadian (5.3%, a difference of 0.16%), British West Indian (5.3%, a difference of 0.31%), and Immigrants from Mexico (5.3%, a difference of 0.38%).
| Demographics | Rating | Rank | Unemployment Among Ages 55 to 59 years |
| Immigrants | Guatemala | 0.0 /100 | #287 | Tragic 5.3% |
| Immigrants | Israel | 0.0 /100 | #288 | Tragic 5.3% |
| Immigrants | Central America | 0.0 /100 | #289 | Tragic 5.3% |
| Sioux | 0.0 /100 | #290 | Tragic 5.3% |
| Trinidadians and Tobagonians | 0.0 /100 | #291 | Tragic 5.3% |
| British West Indians | 0.0 /100 | #292 | Tragic 5.3% |
| Immigrants | Grenada | 0.0 /100 | #293 | Tragic 5.3% |
| Cajuns | 0.0 /100 | #294 | Tragic 5.3% |
| Dutch West Indians | 0.0 /100 | #295 | Tragic 5.3% |
| Barbadians | 0.0 /100 | #296 | Tragic 5.3% |
| Immigrants | Mexico | 0.0 /100 | #297 | Tragic 5.3% |
| Hispanics or Latinos | 0.0 /100 | #298 | Tragic 5.4% |
| Cape Verdeans | 0.0 /100 | #299 | Tragic 5.4% |
| Immigrants | St. Vincent and the Grenadines | 0.0 /100 | #300 | Tragic 5.4% |
| Immigrants | Dominica | 0.0 /100 | #301 | Tragic 5.5% |
Demographics Similar to Immigrants from Eritrea by Unemployment Among Ages 55 to 59 years
In terms of unemployment among ages 55 to 59 years, the demographic groups most similar to Immigrants from Eritrea are Jordanian (4.4%, a difference of 0.010%), Scandinavian (4.5%, a difference of 0.17%), Immigrants from Zimbabwe (4.5%, a difference of 0.18%), Immigrants from Eastern Africa (4.5%, a difference of 0.22%), and Palestinian (4.5%, a difference of 0.26%).
| Demographics | Rating | Rank | Unemployment Among Ages 55 to 59 years |
| Immigrants | Somalia | 100.0 /100 | #18 | Exceptional 4.4% |
| Chinese | 100.0 /100 | #19 | Exceptional 4.4% |
| Swedes | 100.0 /100 | #20 | Exceptional 4.4% |
| Puget Sound Salish | 100.0 /100 | #21 | Exceptional 4.4% |
| Immigrants | Burma/Myanmar | 100.0 /100 | #22 | Exceptional 4.4% |
| Kenyans | 100.0 /100 | #23 | Exceptional 4.4% |
| Jordanians | 100.0 /100 | #24 | Exceptional 4.4% |
| Immigrants | Eritrea | 100.0 /100 | #25 | Exceptional 4.4% |
| Scandinavians | 99.9 /100 | #26 | Exceptional 4.5% |
| Immigrants | Zimbabwe | 99.9 /100 | #27 | Exceptional 4.5% |
| Immigrants | Eastern Africa | 99.9 /100 | #28 | Exceptional 4.5% |
| Palestinians | 99.9 /100 | #29 | Exceptional 4.5% |
| Immigrants | Kenya | 99.9 /100 | #30 | Exceptional 4.5% |
| Germans | 99.9 /100 | #31 | Exceptional 4.5% |
| Immigrants | Ethiopia | 99.9 /100 | #32 | Exceptional 4.5% |