Cajun vs Immigrants from El Salvador Unemployment Among Seniors over 75 years
COMPARE
Cajun
Immigrants from El Salvador
Unemployment Among Seniors over 75 years
Unemployment Among Seniors over 75 years Comparison
Cajuns
Immigrants from El Salvador
12.5%
UNEMPLOYMENT AMONG SENIORS OVER 75 YEARS
0.0/ 100
METRIC RATING
339th/ 347
METRIC RANK
8.7%
UNEMPLOYMENT AMONG SENIORS OVER 75 YEARS
49.7/ 100
METRIC RATING
174th/ 347
METRIC RANK
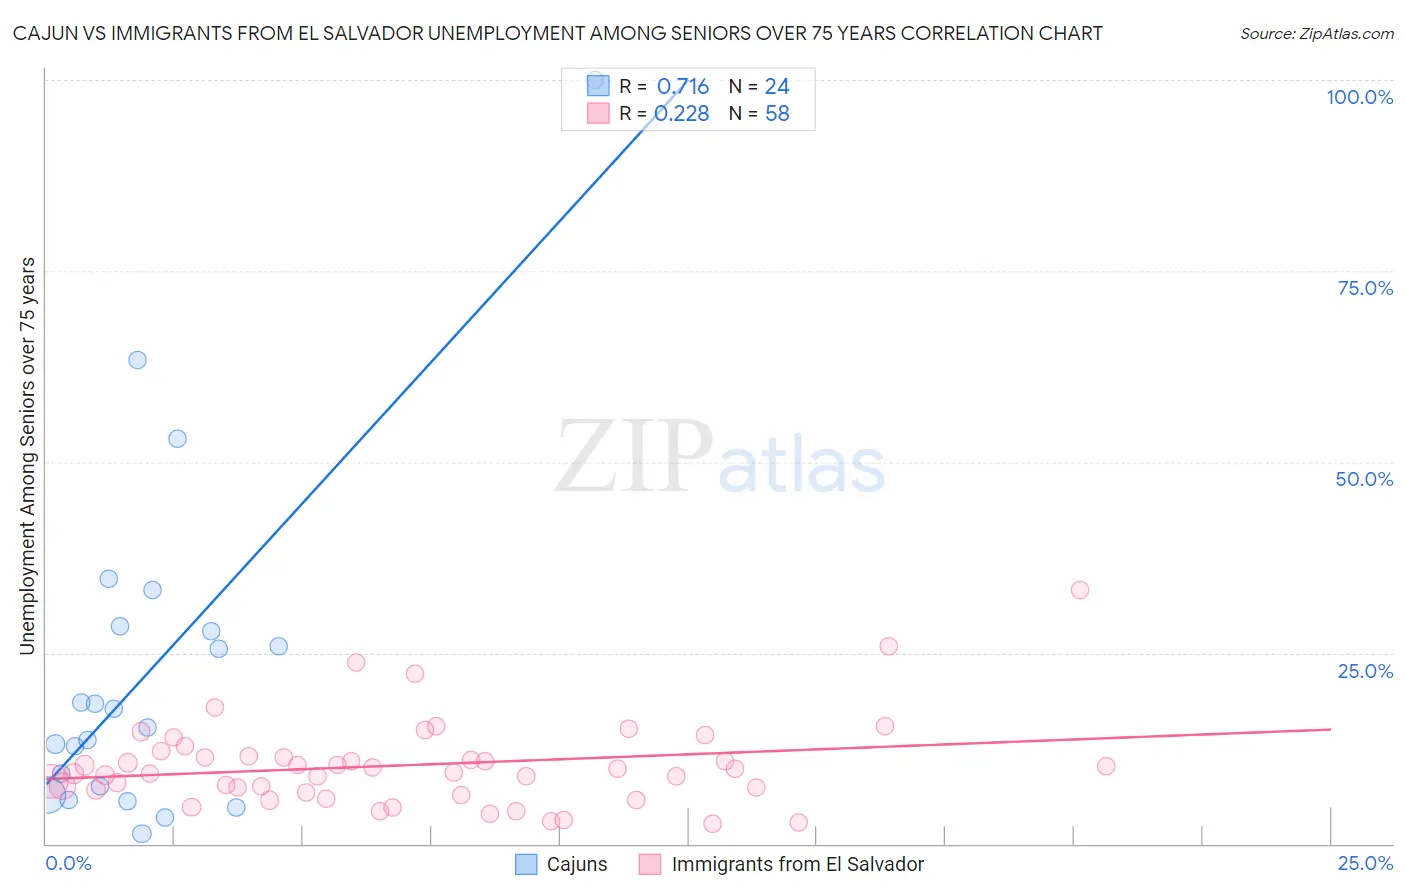
Cajun vs Immigrants from El Salvador Unemployment Among Seniors over 75 years Correlation Chart
The statistical analysis conducted on geographies consisting of 99,585,349 people shows a strong positive correlation between the proportion of Cajuns and unemployment rate among seniors over the age of 75 in the United States with a correlation coefficient (R) of 0.716 and weighted average of 12.5%. Similarly, the statistical analysis conducted on geographies consisting of 188,554,636 people shows a weak positive correlation between the proportion of Immigrants from El Salvador and unemployment rate among seniors over the age of 75 in the United States with a correlation coefficient (R) of 0.228 and weighted average of 8.7%, a difference of 42.7%.
Unemployment Among Seniors over 75 years Correlation Summary
| Measurement | Cajun | Immigrants from El Salvador |
| Minimum | 1.3% | 2.7% |
| Maximum | 100.0% | 33.3% |
| Range | 98.7% | 30.6% |
| Mean | 22.7% | 10.3% |
| Median | 16.4% | 9.6% |
| Interquartile 25% (IQ1) | 6.9% | 7.0% |
| Interquartile 75% (IQ3) | 28.1% | 11.5% |
| Interquartile Range (IQR) | 21.2% | 4.5% |
| Standard Deviation (Sample) | 22.5% | 5.7% |
| Standard Deviation (Population) | 22.1% | 5.7% |
Similar Demographics by Unemployment Among Seniors over 75 years
Demographics Similar to Cajuns by Unemployment Among Seniors over 75 years
In terms of unemployment among seniors over 75 years, the demographic groups most similar to Cajuns are Immigrants from Cabo Verde (12.3%, a difference of 1.3%), Yup'ik (12.8%, a difference of 2.2%), Lumbee (13.5%, a difference of 7.8%), Cape Verdean (11.4%, a difference of 9.4%), and Hmong (13.7%, a difference of 10.0%).
| Demographics | Rating | Rank | Unemployment Among Seniors over 75 years |
| Immigrants | Liberia | 0.0 /100 | #332 | Tragic 10.9% |
| Alaskan Athabascans | 0.0 /100 | #333 | Tragic 11.0% |
| Assyrians/Chaldeans/Syriacs | 0.0 /100 | #334 | Tragic 11.1% |
| French Canadians | 0.0 /100 | #335 | Tragic 11.2% |
| Immigrants | North Macedonia | 0.0 /100 | #336 | Tragic 11.3% |
| Cape Verdeans | 0.0 /100 | #337 | Tragic 11.4% |
| Immigrants | Cabo Verde | 0.0 /100 | #338 | Tragic 12.3% |
| Cajuns | 0.0 /100 | #339 | Tragic 12.5% |
| Yup'ik | 0.0 /100 | #340 | Tragic 12.8% |
| Lumbee | 0.0 /100 | #341 | Tragic 13.5% |
| Hmong | 0.0 /100 | #342 | Tragic 13.7% |
| Alaska Natives | 0.0 /100 | #343 | Tragic 14.7% |
| Immigrants | Yemen | 0.0 /100 | #344 | Tragic 16.5% |
| Yakama | 0.0 /100 | #345 | Tragic 18.4% |
| Tlingit-Haida | 0.0 /100 | #346 | Tragic 20.7% |
Demographics Similar to Immigrants from El Salvador by Unemployment Among Seniors over 75 years
In terms of unemployment among seniors over 75 years, the demographic groups most similar to Immigrants from El Salvador are Syrian (8.7%, a difference of 0.010%), Australian (8.7%, a difference of 0.030%), Immigrants (8.7%, a difference of 0.11%), Dominican (8.7%, a difference of 0.12%), and Zimbabwean (8.7%, a difference of 0.24%).
| Demographics | Rating | Rank | Unemployment Among Seniors over 75 years |
| Immigrants | Eastern Africa | 57.6 /100 | #167 | Average 8.7% |
| Immigrants | Lithuania | 57.2 /100 | #168 | Average 8.7% |
| Fijians | 56.4 /100 | #169 | Average 8.7% |
| Zimbabweans | 54.1 /100 | #170 | Average 8.7% |
| Dominicans | 51.9 /100 | #171 | Average 8.7% |
| Immigrants | Immigrants | 51.8 /100 | #172 | Average 8.7% |
| Australians | 50.3 /100 | #173 | Average 8.7% |
| Immigrants | El Salvador | 49.7 /100 | #174 | Average 8.7% |
| Syrians | 49.6 /100 | #175 | Average 8.7% |
| Somalis | 45.3 /100 | #176 | Average 8.8% |
| Central Americans | 43.3 /100 | #177 | Average 8.8% |
| West Indians | 41.9 /100 | #178 | Average 8.8% |
| Immigrants | Italy | 41.7 /100 | #179 | Average 8.8% |
| Immigrants | Somalia | 41.7 /100 | #180 | Average 8.8% |
| Immigrants | Thailand | 40.2 /100 | #181 | Average 8.8% |