Burmese vs Immigrants from Belize Unemployment Among Women with Children Under 18 years
COMPARE
Burmese
Immigrants from Belize
Unemployment Among Women with Children Under 18 years
Unemployment Among Women with Children Under 18 years Comparison
Burmese
Immigrants from Belize
4.9%
UNEMPLOYMENT AMONG WOMEN WITH CHILDREN UNDER 18 YEARS
99.4/ 100
METRIC RATING
30th/ 347
METRIC RANK
6.7%
UNEMPLOYMENT AMONG WOMEN WITH CHILDREN UNDER 18 YEARS
0.0/ 100
METRIC RATING
320th/ 347
METRIC RANK
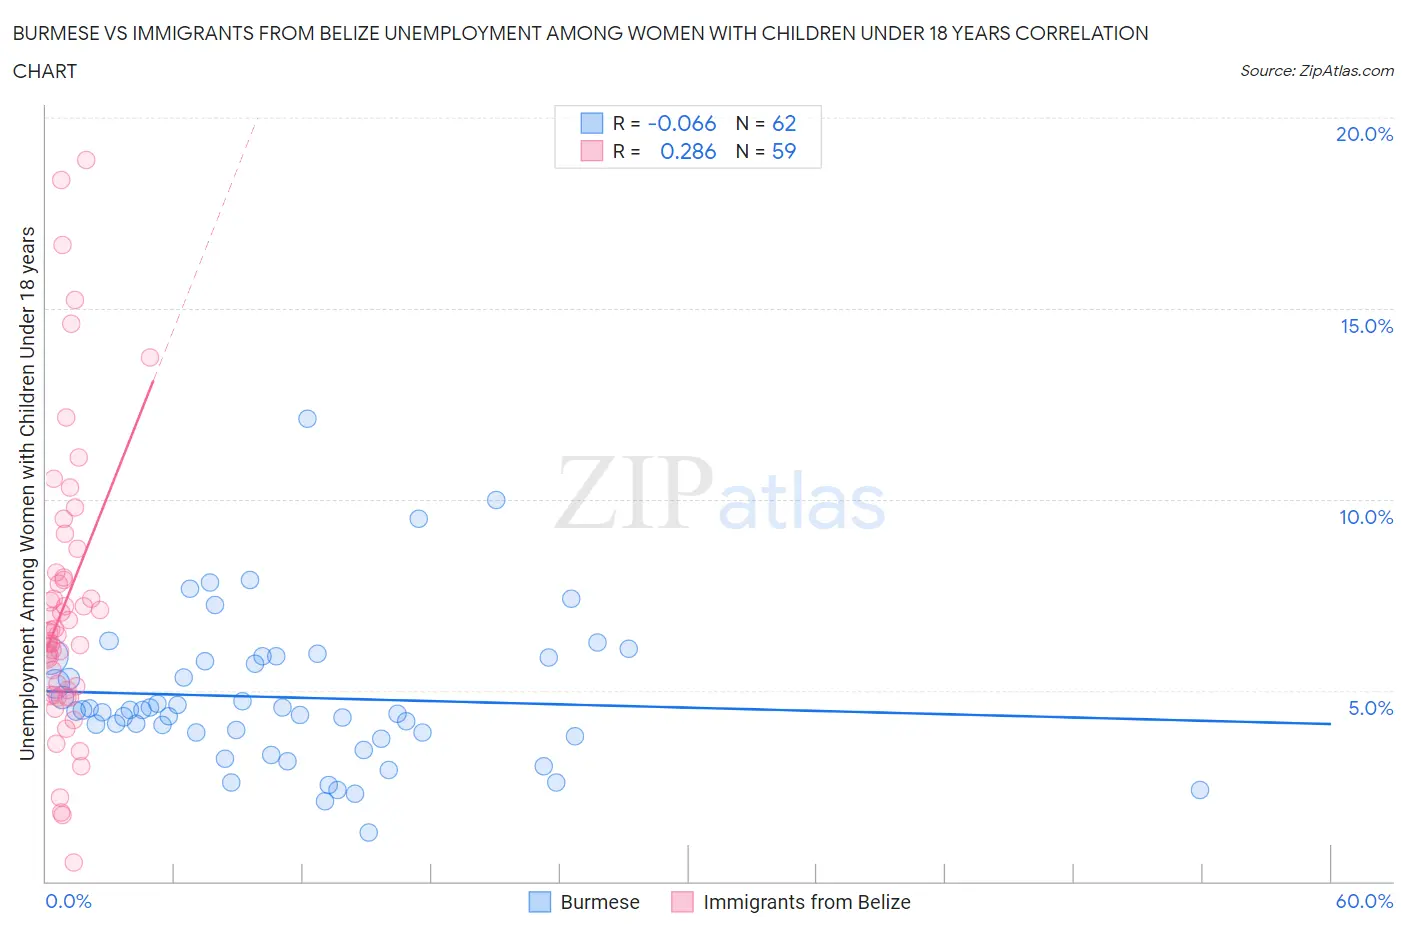
Burmese vs Immigrants from Belize Unemployment Among Women with Children Under 18 years Correlation Chart
The statistical analysis conducted on geographies consisting of 441,383,037 people shows a slight negative correlation between the proportion of Burmese and unemployment rate among women with children under the age of 18 in the United States with a correlation coefficient (R) of -0.066 and weighted average of 4.9%. Similarly, the statistical analysis conducted on geographies consisting of 128,888,492 people shows a weak positive correlation between the proportion of Immigrants from Belize and unemployment rate among women with children under the age of 18 in the United States with a correlation coefficient (R) of 0.286 and weighted average of 6.7%, a difference of 34.9%.
Unemployment Among Women with Children Under 18 years Correlation Summary
| Measurement | Burmese | Immigrants from Belize |
| Minimum | 1.3% | 0.50% |
| Maximum | 12.1% | 18.9% |
| Range | 10.8% | 18.4% |
| Mean | 4.8% | 7.3% |
| Median | 4.5% | 6.5% |
| Interquartile 25% (IQ1) | 3.8% | 4.9% |
| Interquartile 75% (IQ3) | 5.9% | 8.1% |
| Interquartile Range (IQR) | 2.1% | 3.2% |
| Standard Deviation (Sample) | 2.0% | 3.8% |
| Standard Deviation (Population) | 1.9% | 3.8% |
Similar Demographics by Unemployment Among Women with Children Under 18 years
Demographics Similar to Burmese by Unemployment Among Women with Children Under 18 years
In terms of unemployment among women with children under 18 years, the demographic groups most similar to Burmese are Finnish (4.9%, a difference of 0.070%), Immigrants from Eastern Asia (4.9%, a difference of 0.12%), Cypriot (5.0%, a difference of 0.22%), Soviet Union (4.9%, a difference of 0.28%), and Dutch (5.0%, a difference of 0.32%).
| Demographics | Rating | Rank | Unemployment Among Women with Children Under 18 years |
| Immigrants | China | 99.6 /100 | #23 | Exceptional 4.9% |
| Belgians | 99.5 /100 | #24 | Exceptional 4.9% |
| Chinese | 99.5 /100 | #25 | Exceptional 4.9% |
| Swiss | 99.5 /100 | #26 | Exceptional 4.9% |
| Soviet Union | 99.5 /100 | #27 | Exceptional 4.9% |
| Immigrants | Eastern Asia | 99.5 /100 | #28 | Exceptional 4.9% |
| Finns | 99.4 /100 | #29 | Exceptional 4.9% |
| Burmese | 99.4 /100 | #30 | Exceptional 4.9% |
| Cypriots | 99.3 /100 | #31 | Exceptional 5.0% |
| Dutch | 99.3 /100 | #32 | Exceptional 5.0% |
| Croatians | 99.3 /100 | #33 | Exceptional 5.0% |
| Immigrants | South Central Asia | 99.2 /100 | #34 | Exceptional 5.0% |
| Luxembourgers | 99.2 /100 | #35 | Exceptional 5.0% |
| Mongolians | 99.2 /100 | #36 | Exceptional 5.0% |
| Poles | 99.2 /100 | #37 | Exceptional 5.0% |
Demographics Similar to Immigrants from Belize by Unemployment Among Women with Children Under 18 years
In terms of unemployment among women with children under 18 years, the demographic groups most similar to Immigrants from Belize are U.S. Virgin Islander (6.7%, a difference of 0.050%), Central American Indian (6.7%, a difference of 0.090%), Alaska Native (6.7%, a difference of 0.33%), Shoshone (6.6%, a difference of 0.62%), and Immigrants from Ecuador (6.6%, a difference of 0.66%).
| Demographics | Rating | Rank | Unemployment Among Women with Children Under 18 years |
| Hispanics or Latinos | 0.0 /100 | #313 | Tragic 6.6% |
| British West Indians | 0.0 /100 | #314 | Tragic 6.6% |
| Immigrants | West Indies | 0.0 /100 | #315 | Tragic 6.6% |
| Immigrants | Ecuador | 0.0 /100 | #316 | Tragic 6.6% |
| Shoshone | 0.0 /100 | #317 | Tragic 6.6% |
| Alaska Natives | 0.0 /100 | #318 | Tragic 6.7% |
| Central American Indians | 0.0 /100 | #319 | Tragic 6.7% |
| Immigrants | Belize | 0.0 /100 | #320 | Tragic 6.7% |
| U.S. Virgin Islanders | 0.0 /100 | #321 | Tragic 6.7% |
| Houma | 0.0 /100 | #322 | Tragic 6.8% |
| Pueblo | 0.0 /100 | #323 | Tragic 6.8% |
| Paiute | 0.0 /100 | #324 | Tragic 6.9% |
| Immigrants | Dominica | 0.0 /100 | #325 | Tragic 7.0% |
| Chippewa | 0.0 /100 | #326 | Tragic 7.0% |
| Lumbee | 0.0 /100 | #327 | Tragic 7.1% |