Bulgarian vs Scandinavian Unemployment Among Youth under 25 years
COMPARE
Bulgarian
Scandinavian
Unemployment Among Youth under 25 years
Unemployment Among Youth under 25 years Comparison
Bulgarians
Scandinavians
10.9%
UNEMPLOYMENT AMONG YOUTH UNDER 25 YEARS
99.6/ 100
METRIC RATING
45th/ 347
METRIC RANK
10.5%
UNEMPLOYMENT AMONG YOUTH UNDER 25 YEARS
100.0/ 100
METRIC RATING
11th/ 347
METRIC RANK
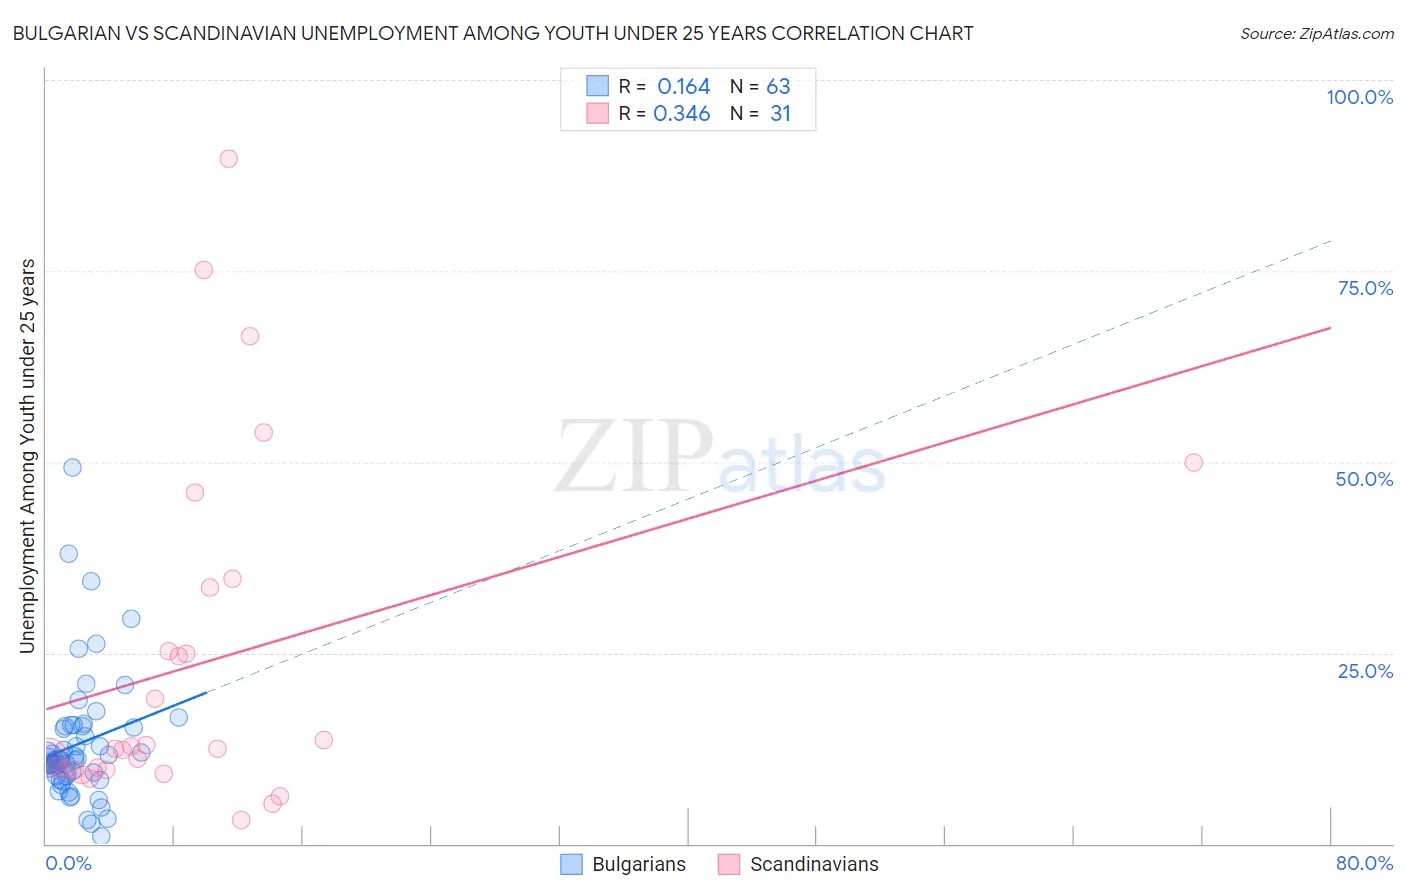
Bulgarian vs Scandinavian Unemployment Among Youth under 25 years Correlation Chart
The statistical analysis conducted on geographies consisting of 204,435,846 people shows a poor positive correlation between the proportion of Bulgarians and unemployment rate among youth under the age of 25 in the United States with a correlation coefficient (R) of 0.164 and weighted average of 10.9%. Similarly, the statistical analysis conducted on geographies consisting of 460,589,889 people shows a mild positive correlation between the proportion of Scandinavians and unemployment rate among youth under the age of 25 in the United States with a correlation coefficient (R) of 0.346 and weighted average of 10.5%, a difference of 3.9%.
Unemployment Among Youth under 25 years Correlation Summary
| Measurement | Bulgarian | Scandinavian |
| Minimum | 1.0% | 3.1% |
| Maximum | 49.3% | 89.7% |
| Range | 48.3% | 86.6% |
| Mean | 13.0% | 23.6% |
| Median | 11.0% | 12.5% |
| Interquartile 25% (IQ1) | 8.8% | 9.7% |
| Interquartile 75% (IQ3) | 15.3% | 33.6% |
| Interquartile Range (IQR) | 6.5% | 23.9% |
| Standard Deviation (Sample) | 8.3% | 22.3% |
| Standard Deviation (Population) | 8.2% | 21.9% |
Similar Demographics by Unemployment Among Youth under 25 years
Demographics Similar to Bulgarians by Unemployment Among Youth under 25 years
In terms of unemployment among youth under 25 years, the demographic groups most similar to Bulgarians are Tongan (10.9%, a difference of 0.040%), Australian (10.9%, a difference of 0.080%), Welsh (10.9%, a difference of 0.10%), British (10.9%, a difference of 0.13%), and Cambodian (10.9%, a difference of 0.38%).
| Demographics | Rating | Rank | Unemployment Among Youth under 25 years |
| Immigrants | Congo | 99.8 /100 | #38 | Exceptional 10.9% |
| Immigrants | Zaire | 99.8 /100 | #39 | Exceptional 10.9% |
| Scottish | 99.8 /100 | #40 | Exceptional 10.9% |
| Croatians | 99.8 /100 | #41 | Exceptional 10.9% |
| Cambodians | 99.7 /100 | #42 | Exceptional 10.9% |
| British | 99.7 /100 | #43 | Exceptional 10.9% |
| Welsh | 99.7 /100 | #44 | Exceptional 10.9% |
| Bulgarians | 99.6 /100 | #45 | Exceptional 10.9% |
| Tongans | 99.6 /100 | #46 | Exceptional 10.9% |
| Australians | 99.6 /100 | #47 | Exceptional 10.9% |
| Poles | 99.3 /100 | #48 | Exceptional 11.0% |
| Thais | 99.3 /100 | #49 | Exceptional 11.0% |
| Czechoslovakians | 99.2 /100 | #50 | Exceptional 11.0% |
| Serbians | 99.0 /100 | #51 | Exceptional 11.0% |
| Latvians | 99.0 /100 | #52 | Exceptional 11.0% |
Demographics Similar to Scandinavians by Unemployment Among Youth under 25 years
In terms of unemployment among youth under 25 years, the demographic groups most similar to Scandinavians are Immigrants from Somalia (10.5%, a difference of 0.13%), German (10.5%, a difference of 0.15%), Immigrants from Sudan (10.5%, a difference of 0.18%), Indonesian (10.6%, a difference of 0.30%), and Cuban (10.6%, a difference of 0.32%).
| Demographics | Rating | Rank | Unemployment Among Youth under 25 years |
| Zimbabweans | 100.0 /100 | #4 | Exceptional 10.2% |
| Czechs | 100.0 /100 | #5 | Exceptional 10.3% |
| Danes | 100.0 /100 | #6 | Exceptional 10.3% |
| Swedes | 100.0 /100 | #7 | Exceptional 10.4% |
| Immigrants | Venezuela | 100.0 /100 | #8 | Exceptional 10.5% |
| Germans | 100.0 /100 | #9 | Exceptional 10.5% |
| Immigrants | Somalia | 100.0 /100 | #10 | Exceptional 10.5% |
| Scandinavians | 100.0 /100 | #11 | Exceptional 10.5% |
| Immigrants | Sudan | 100.0 /100 | #12 | Exceptional 10.5% |
| Indonesians | 100.0 /100 | #13 | Exceptional 10.6% |
| Cubans | 100.0 /100 | #14 | Exceptional 10.6% |
| Sudanese | 100.0 /100 | #15 | Exceptional 10.6% |
| Venezuelans | 100.0 /100 | #16 | Exceptional 10.6% |
| Menominee | 100.0 /100 | #17 | Exceptional 10.6% |
| Swiss | 100.0 /100 | #18 | Exceptional 10.6% |