Bulgarian vs Immigrants from Kazakhstan Unemployment Among Ages 20 to 24 years
COMPARE
Bulgarian
Immigrants from Kazakhstan
Unemployment Among Ages 20 to 24 years
Unemployment Among Ages 20 to 24 years Comparison
Bulgarians
Immigrants from Kazakhstan
9.9%
UNEMPLOYMENT AMONG AGES 20 TO 24 YEARS
99.1/ 100
METRIC RATING
69th/ 347
METRIC RANK
10.2%
UNEMPLOYMENT AMONG AGES 20 TO 24 YEARS
65.5/ 100
METRIC RATING
158th/ 347
METRIC RANK
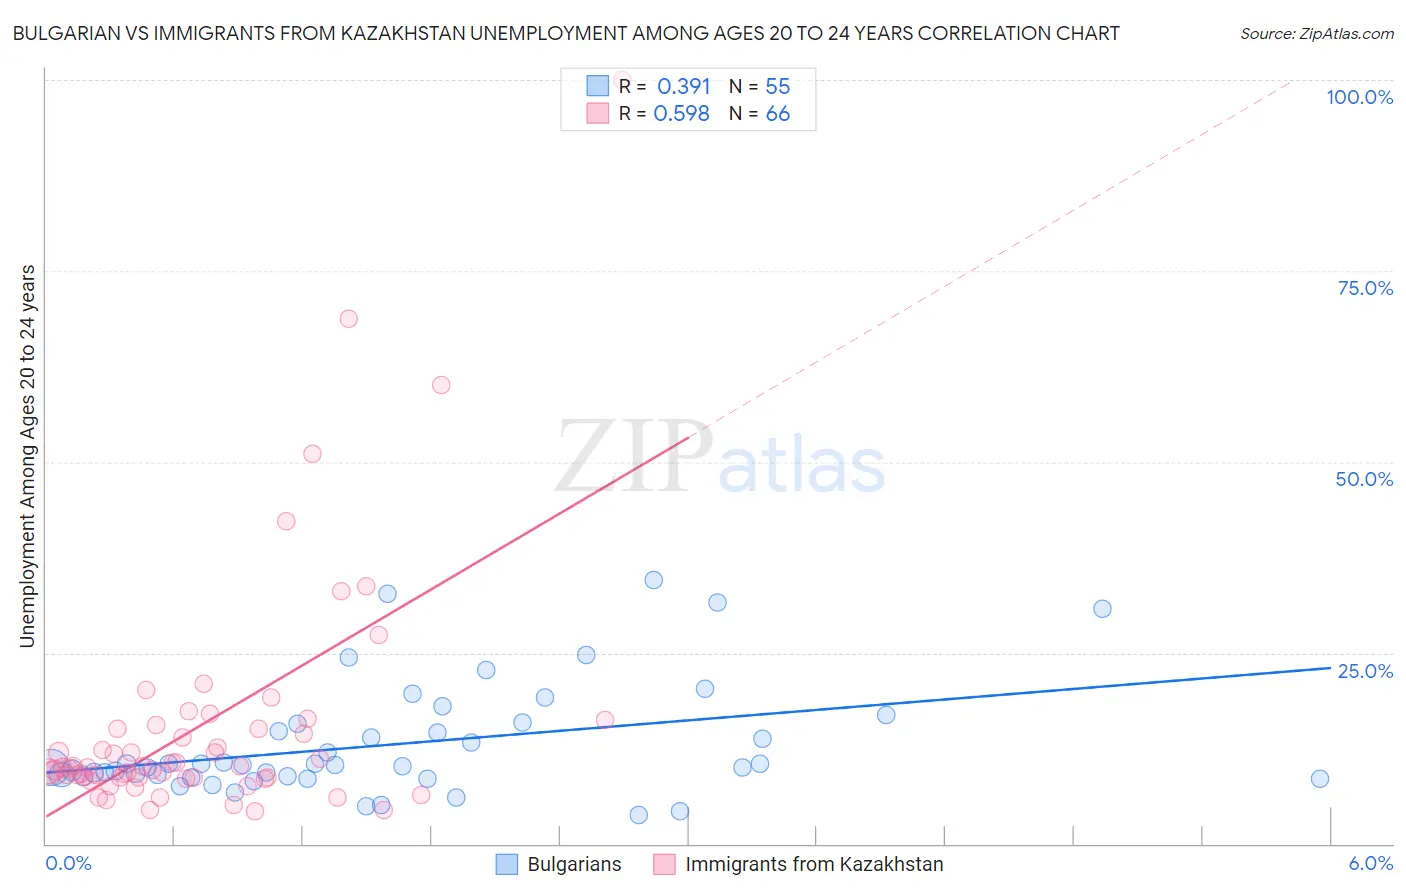
Bulgarian vs Immigrants from Kazakhstan Unemployment Among Ages 20 to 24 years Correlation Chart
The statistical analysis conducted on geographies consisting of 202,381,943 people shows a mild positive correlation between the proportion of Bulgarians and unemployment rate among population between the ages 20 and 24 in the United States with a correlation coefficient (R) of 0.391 and weighted average of 9.9%. Similarly, the statistical analysis conducted on geographies consisting of 123,442,616 people shows a substantial positive correlation between the proportion of Immigrants from Kazakhstan and unemployment rate among population between the ages 20 and 24 in the United States with a correlation coefficient (R) of 0.598 and weighted average of 10.2%, a difference of 3.9%.
Unemployment Among Ages 20 to 24 years Correlation Summary
| Measurement | Bulgarian | Immigrants from Kazakhstan |
| Minimum | 3.8% | 4.3% |
| Maximum | 34.5% | 100.0% |
| Range | 30.7% | 95.7% |
| Mean | 13.0% | 15.5% |
| Median | 10.3% | 9.9% |
| Interquartile 25% (IQ1) | 8.8% | 8.6% |
| Interquartile 75% (IQ3) | 15.6% | 15.0% |
| Interquartile Range (IQR) | 6.8% | 6.4% |
| Standard Deviation (Sample) | 7.3% | 16.2% |
| Standard Deviation (Population) | 7.2% | 16.1% |
Similar Demographics by Unemployment Among Ages 20 to 24 years
Demographics Similar to Bulgarians by Unemployment Among Ages 20 to 24 years
In terms of unemployment among ages 20 to 24 years, the demographic groups most similar to Bulgarians are Mongolian (9.9%, a difference of 0.080%), Immigrants from Croatia (9.9%, a difference of 0.12%), Immigrants from Bolivia (9.9%, a difference of 0.13%), Celtic (9.9%, a difference of 0.15%), and Bolivian (9.9%, a difference of 0.19%).
| Demographics | Rating | Rank | Unemployment Among Ages 20 to 24 years |
| Immigrants | Singapore | 99.4 /100 | #62 | Exceptional 9.8% |
| British | 99.4 /100 | #63 | Exceptional 9.8% |
| Serbians | 99.4 /100 | #64 | Exceptional 9.8% |
| Welsh | 99.3 /100 | #65 | Exceptional 9.8% |
| Scottish | 99.3 /100 | #66 | Exceptional 9.8% |
| Immigrants | Bolivia | 99.2 /100 | #67 | Exceptional 9.9% |
| Mongolians | 99.1 /100 | #68 | Exceptional 9.9% |
| Bulgarians | 99.1 /100 | #69 | Exceptional 9.9% |
| Immigrants | Croatia | 99.0 /100 | #70 | Exceptional 9.9% |
| Celtics | 98.9 /100 | #71 | Exceptional 9.9% |
| Bolivians | 98.9 /100 | #72 | Exceptional 9.9% |
| Kenyans | 98.7 /100 | #73 | Exceptional 9.9% |
| Immigrants | Laos | 98.7 /100 | #74 | Exceptional 9.9% |
| Immigrants | Australia | 98.6 /100 | #75 | Exceptional 9.9% |
| Czechoslovakians | 98.4 /100 | #76 | Exceptional 9.9% |
Demographics Similar to Immigrants from Kazakhstan by Unemployment Among Ages 20 to 24 years
In terms of unemployment among ages 20 to 24 years, the demographic groups most similar to Immigrants from Kazakhstan are Immigrants from Uganda (10.2%, a difference of 0.010%), Canadian (10.2%, a difference of 0.050%), Immigrants from England (10.3%, a difference of 0.070%), Spaniard (10.3%, a difference of 0.080%), and Indian (Asian) (10.3%, a difference of 0.11%).
| Demographics | Rating | Rank | Unemployment Among Ages 20 to 24 years |
| Immigrants | South Africa | 73.6 /100 | #151 | Good 10.2% |
| Iranians | 72.4 /100 | #152 | Good 10.2% |
| Immigrants | Taiwan | 71.4 /100 | #153 | Good 10.2% |
| Immigrants | Switzerland | 71.3 /100 | #154 | Good 10.2% |
| Lithuanians | 70.0 /100 | #155 | Good 10.2% |
| Canadians | 66.7 /100 | #156 | Good 10.2% |
| Immigrants | Uganda | 65.6 /100 | #157 | Good 10.2% |
| Immigrants | Kazakhstan | 65.5 /100 | #158 | Good 10.2% |
| Immigrants | England | 63.7 /100 | #159 | Good 10.3% |
| Spaniards | 63.4 /100 | #160 | Good 10.3% |
| Indians (Asian) | 62.6 /100 | #161 | Good 10.3% |
| Immigrants | Asia | 61.3 /100 | #162 | Good 10.3% |
| Estonians | 61.1 /100 | #163 | Good 10.3% |
| Immigrants | Korea | 59.0 /100 | #164 | Average 10.3% |
| Lebanese | 58.3 /100 | #165 | Average 10.3% |