British West Indian vs Asian Unemployment Among Seniors over 75 years
COMPARE
British West Indian
Asian
Unemployment Among Seniors over 75 years
Unemployment Among Seniors over 75 years Comparison
British West Indians
Asians
7.8%
UNEMPLOYMENT AMONG SENIORS OVER 75 YEARS
100.0/ 100
METRIC RATING
45th/ 347
METRIC RANK
8.3%
UNEMPLOYMENT AMONG SENIORS OVER 75 YEARS
98.5/ 100
METRIC RATING
113th/ 347
METRIC RANK
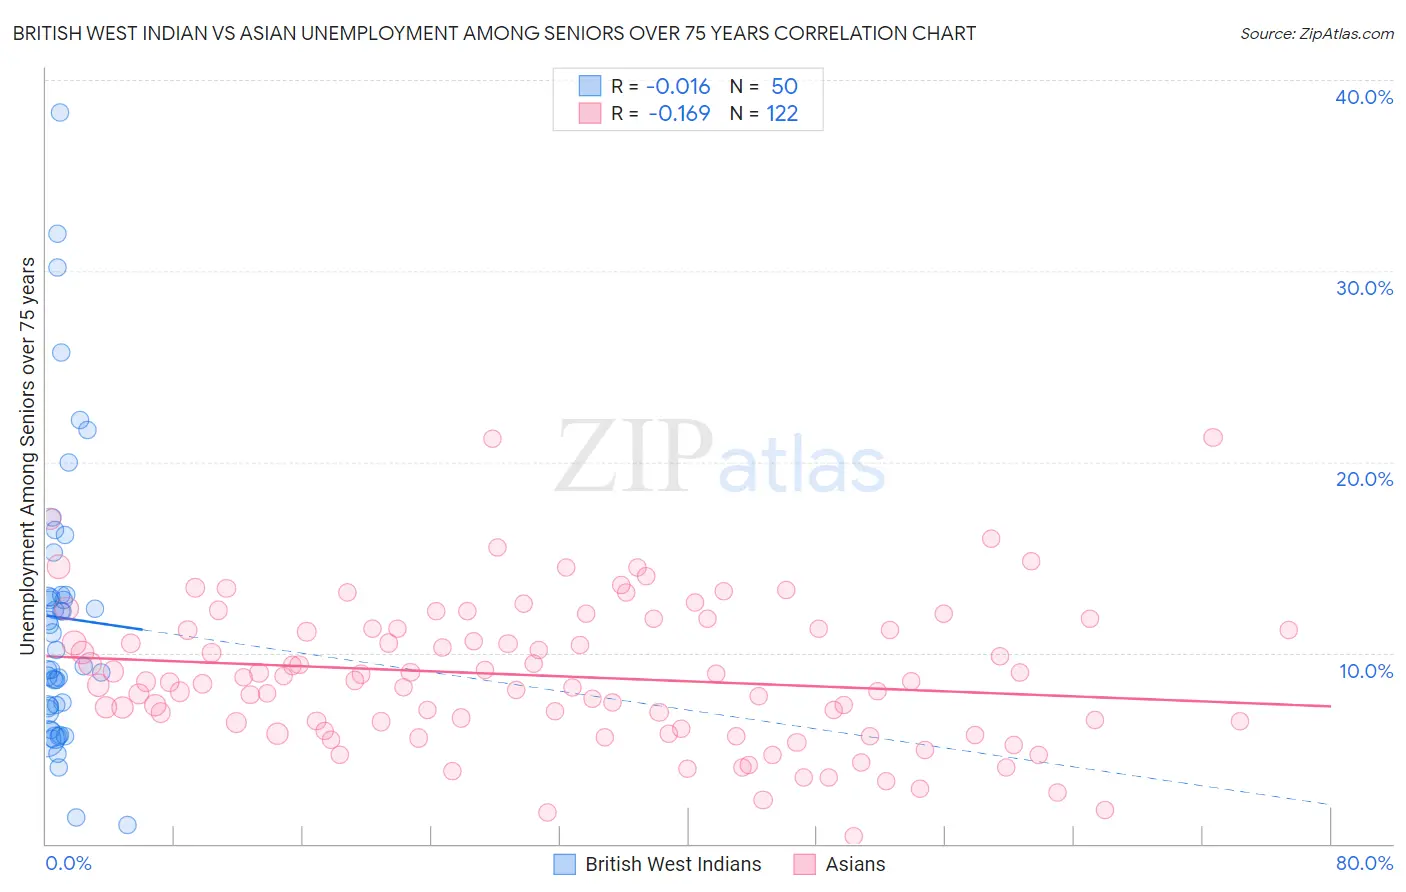
British West Indian vs Asian Unemployment Among Seniors over 75 years Correlation Chart
The statistical analysis conducted on geographies consisting of 104,084,250 people shows no correlation between the proportion of British West Indians and unemployment rate among seniors over the age of 75 in the United States with a correlation coefficient (R) of -0.016 and weighted average of 7.8%. Similarly, the statistical analysis conducted on geographies consisting of 233,630,058 people shows a poor negative correlation between the proportion of Asians and unemployment rate among seniors over the age of 75 in the United States with a correlation coefficient (R) of -0.169 and weighted average of 8.3%, a difference of 6.3%.
Unemployment Among Seniors over 75 years Correlation Summary
| Measurement | British West Indian | Asian |
| Minimum | 1.0% | 0.40% |
| Maximum | 38.3% | 21.3% |
| Range | 37.3% | 20.9% |
| Mean | 11.8% | 8.8% |
| Median | 9.7% | 8.5% |
| Interquartile 25% (IQ1) | 7.2% | 6.0% |
| Interquartile 75% (IQ3) | 13.0% | 11.2% |
| Interquartile Range (IQR) | 5.8% | 5.2% |
| Standard Deviation (Sample) | 7.5% | 3.8% |
| Standard Deviation (Population) | 7.5% | 3.8% |
Similar Demographics by Unemployment Among Seniors over 75 years
Demographics Similar to British West Indians by Unemployment Among Seniors over 75 years
In terms of unemployment among seniors over 75 years, the demographic groups most similar to British West Indians are Immigrants from Spain (7.8%, a difference of 0.010%), Immigrants from Denmark (7.8%, a difference of 0.050%), Immigrants from China (7.8%, a difference of 0.060%), Pueblo (7.7%, a difference of 0.34%), and Creek (7.8%, a difference of 0.47%).
| Demographics | Rating | Rank | Unemployment Among Seniors over 75 years |
| Kiowa | 100.0 /100 | #38 | Exceptional 7.7% |
| Ugandans | 100.0 /100 | #39 | Exceptional 7.7% |
| Colville | 100.0 /100 | #40 | Exceptional 7.7% |
| Immigrants | Burma/Myanmar | 100.0 /100 | #41 | Exceptional 7.7% |
| Pueblo | 100.0 /100 | #42 | Exceptional 7.7% |
| Immigrants | Denmark | 100.0 /100 | #43 | Exceptional 7.8% |
| Immigrants | Spain | 100.0 /100 | #44 | Exceptional 7.8% |
| British West Indians | 100.0 /100 | #45 | Exceptional 7.8% |
| Immigrants | China | 100.0 /100 | #46 | Exceptional 7.8% |
| Creek | 100.0 /100 | #47 | Exceptional 7.8% |
| Immigrants | Chile | 100.0 /100 | #48 | Exceptional 7.8% |
| Potawatomi | 100.0 /100 | #49 | Exceptional 7.8% |
| Immigrants | Latvia | 100.0 /100 | #50 | Exceptional 7.8% |
| Moroccans | 100.0 /100 | #51 | Exceptional 7.8% |
| Bahamians | 100.0 /100 | #52 | Exceptional 7.8% |
Demographics Similar to Asians by Unemployment Among Seniors over 75 years
In terms of unemployment among seniors over 75 years, the demographic groups most similar to Asians are Immigrants from India (8.2%, a difference of 0.060%), Trinidadian and Tobagonian (8.3%, a difference of 0.15%), French American Indian (8.2%, a difference of 0.18%), Marshallese (8.2%, a difference of 0.23%), and Immigrants from Lebanon (8.2%, a difference of 0.26%).
| Demographics | Rating | Rank | Unemployment Among Seniors over 75 years |
| Immigrants | Honduras | 99.0 /100 | #106 | Exceptional 8.2% |
| Sri Lankans | 98.9 /100 | #107 | Exceptional 8.2% |
| Laotians | 98.8 /100 | #108 | Exceptional 8.2% |
| Immigrants | Lebanon | 98.8 /100 | #109 | Exceptional 8.2% |
| Marshallese | 98.7 /100 | #110 | Exceptional 8.2% |
| French American Indians | 98.7 /100 | #111 | Exceptional 8.2% |
| Immigrants | India | 98.6 /100 | #112 | Exceptional 8.2% |
| Asians | 98.5 /100 | #113 | Exceptional 8.3% |
| Trinidadians and Tobagonians | 98.4 /100 | #114 | Exceptional 8.3% |
| Sudanese | 98.2 /100 | #115 | Exceptional 8.3% |
| Immigrants | West Indies | 98.1 /100 | #116 | Exceptional 8.3% |
| Immigrants | Greece | 97.9 /100 | #117 | Exceptional 8.3% |
| Immigrants | Middle Africa | 97.9 /100 | #118 | Exceptional 8.3% |
| Japanese | 97.5 /100 | #119 | Exceptional 8.3% |
| Immigrants | Asia | 97.4 /100 | #120 | Exceptional 8.3% |