British vs Pakistani Unemployment Among Ages 65 to 74 years
COMPARE
British
Pakistani
Unemployment Among Ages 65 to 74 years
Unemployment Among Ages 65 to 74 years Comparison
British
Pakistanis
5.2%
UNEMPLOYMENT AMONG AGES 65 TO 74 YEARS
97.9/ 100
METRIC RATING
85th/ 347
METRIC RANK
5.3%
UNEMPLOYMENT AMONG AGES 65 TO 74 YEARS
87.5/ 100
METRIC RATING
125th/ 347
METRIC RANK
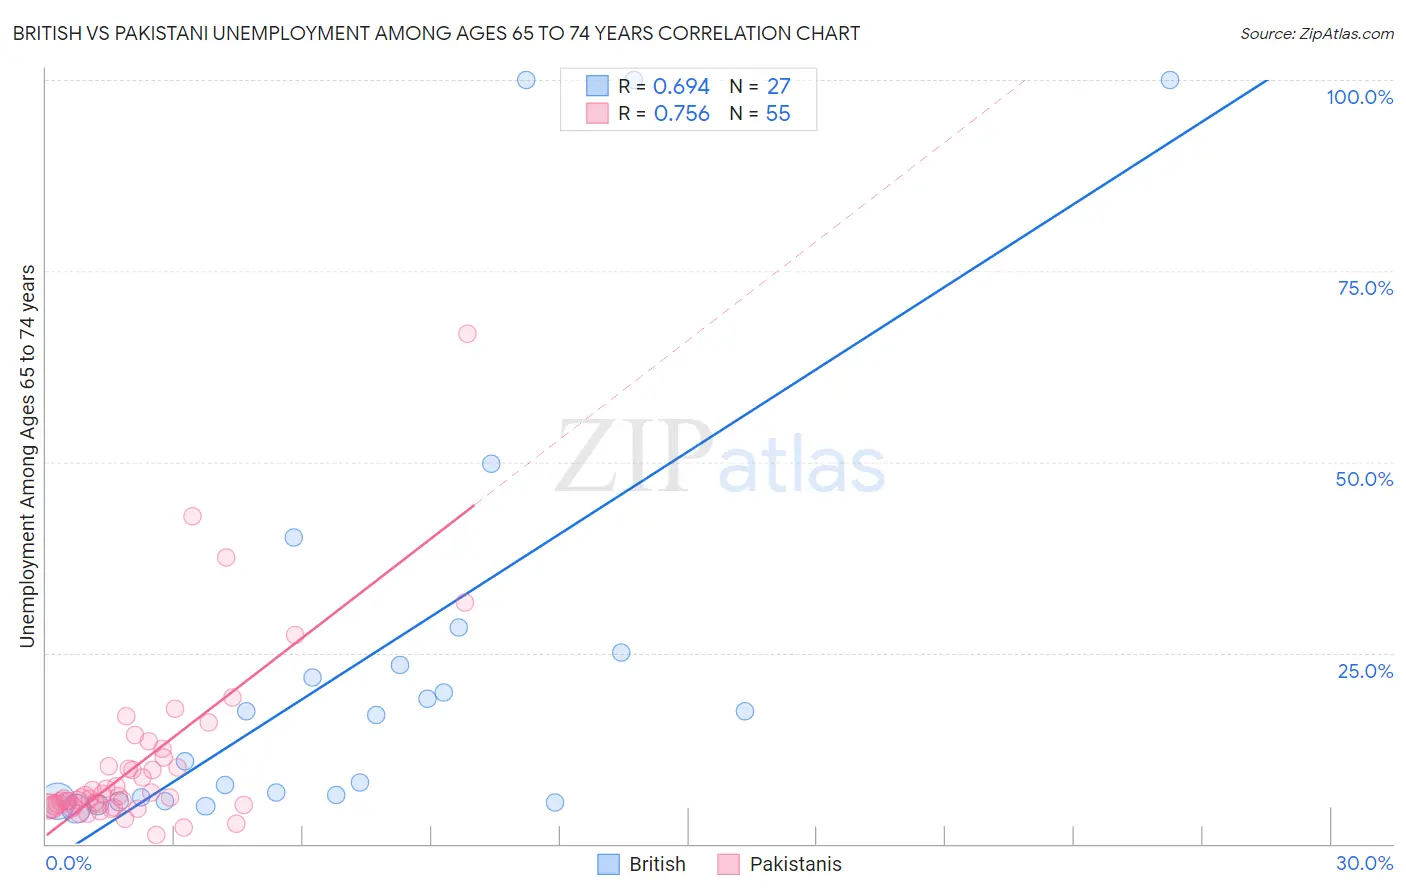
British vs Pakistani Unemployment Among Ages 65 to 74 years Correlation Chart
The statistical analysis conducted on geographies consisting of 428,425,960 people shows a significant positive correlation between the proportion of British and unemployment rate among population between the ages 65 and 74 in the United States with a correlation coefficient (R) of 0.694 and weighted average of 5.2%. Similarly, the statistical analysis conducted on geographies consisting of 302,647,263 people shows a strong positive correlation between the proportion of Pakistanis and unemployment rate among population between the ages 65 and 74 in the United States with a correlation coefficient (R) of 0.756 and weighted average of 5.3%, a difference of 1.6%.
Unemployment Among Ages 65 to 74 years Correlation Summary
| Measurement | British | Pakistani |
| Minimum | 4.6% | 1.1% |
| Maximum | 100.0% | 66.7% |
| Range | 95.4% | 65.6% |
| Mean | 24.5% | 10.4% |
| Median | 16.8% | 6.1% |
| Interquartile 25% (IQ1) | 5.6% | 5.0% |
| Interquartile 75% (IQ3) | 25.0% | 10.2% |
| Interquartile Range (IQR) | 19.4% | 5.3% |
| Standard Deviation (Sample) | 29.4% | 11.4% |
| Standard Deviation (Population) | 28.9% | 11.3% |
Similar Demographics by Unemployment Among Ages 65 to 74 years
Demographics Similar to British by Unemployment Among Ages 65 to 74 years
In terms of unemployment among ages 65 to 74 years, the demographic groups most similar to British are Danish (5.2%, a difference of 0.010%), Scottish (5.2%, a difference of 0.010%), Immigrants from Saudi Arabia (5.2%, a difference of 0.030%), English (5.2%, a difference of 0.030%), and Immigrants from Hungary (5.2%, a difference of 0.040%).
| Demographics | Rating | Rank | Unemployment Among Ages 65 to 74 years |
| Northern Europeans | 98.9 /100 | #78 | Exceptional 5.2% |
| Slavs | 98.7 /100 | #79 | Exceptional 5.2% |
| Immigrants | South Africa | 98.6 /100 | #80 | Exceptional 5.2% |
| Immigrants | Scotland | 98.6 /100 | #81 | Exceptional 5.2% |
| Thais | 98.6 /100 | #82 | Exceptional 5.2% |
| Immigrants | Middle Africa | 98.4 /100 | #83 | Exceptional 5.2% |
| Immigrants | Hungary | 98.0 /100 | #84 | Exceptional 5.2% |
| British | 97.9 /100 | #85 | Exceptional 5.2% |
| Danes | 97.9 /100 | #86 | Exceptional 5.2% |
| Scottish | 97.9 /100 | #87 | Exceptional 5.2% |
| Immigrants | Saudi Arabia | 97.9 /100 | #88 | Exceptional 5.2% |
| English | 97.8 /100 | #89 | Exceptional 5.2% |
| Luxembourgers | 97.6 /100 | #90 | Exceptional 5.2% |
| Romanians | 97.4 /100 | #91 | Exceptional 5.2% |
| Puget Sound Salish | 97.3 /100 | #92 | Exceptional 5.2% |
Demographics Similar to Pakistanis by Unemployment Among Ages 65 to 74 years
In terms of unemployment among ages 65 to 74 years, the demographic groups most similar to Pakistanis are Immigrants from Ukraine (5.3%, a difference of 0.010%), Immigrants from South Eastern Asia (5.3%, a difference of 0.020%), Immigrants from North America (5.3%, a difference of 0.060%), Immigrants from Hong Kong (5.3%, a difference of 0.070%), and Czechoslovakian (5.3%, a difference of 0.090%).
| Demographics | Rating | Rank | Unemployment Among Ages 65 to 74 years |
| Immigrants | Belarus | 90.1 /100 | #118 | Exceptional 5.3% |
| Immigrants | Fiji | 89.9 /100 | #119 | Excellent 5.3% |
| Immigrants | Switzerland | 89.9 /100 | #120 | Excellent 5.3% |
| Immigrants | Australia | 89.1 /100 | #121 | Excellent 5.3% |
| Immigrants | Canada | 89.0 /100 | #122 | Excellent 5.3% |
| Czechoslovakians | 88.6 /100 | #123 | Excellent 5.3% |
| Immigrants | Ukraine | 87.5 /100 | #124 | Excellent 5.3% |
| Pakistanis | 87.5 /100 | #125 | Excellent 5.3% |
| Immigrants | South Eastern Asia | 87.2 /100 | #126 | Excellent 5.3% |
| Immigrants | North America | 86.7 /100 | #127 | Excellent 5.3% |
| Immigrants | Hong Kong | 86.5 /100 | #128 | Excellent 5.3% |
| Immigrants | England | 86.2 /100 | #129 | Excellent 5.3% |
| Eastern Europeans | 85.6 /100 | #130 | Excellent 5.3% |
| Immigrants | Russia | 83.0 /100 | #131 | Excellent 5.3% |
| Koreans | 82.6 /100 | #132 | Excellent 5.3% |