Bolivian vs Seminole Unemployment Among Ages 65 to 74 years
COMPARE
Bolivian
Seminole
Unemployment Among Ages 65 to 74 years
Unemployment Among Ages 65 to 74 years Comparison
Bolivians
Seminole
5.1%
UNEMPLOYMENT AMONG AGES 65 TO 74 YEARS
99.3/ 100
METRIC RATING
65th/ 347
METRIC RANK
5.4%
UNEMPLOYMENT AMONG AGES 65 TO 74 YEARS
14.3/ 100
METRIC RATING
204th/ 347
METRIC RANK
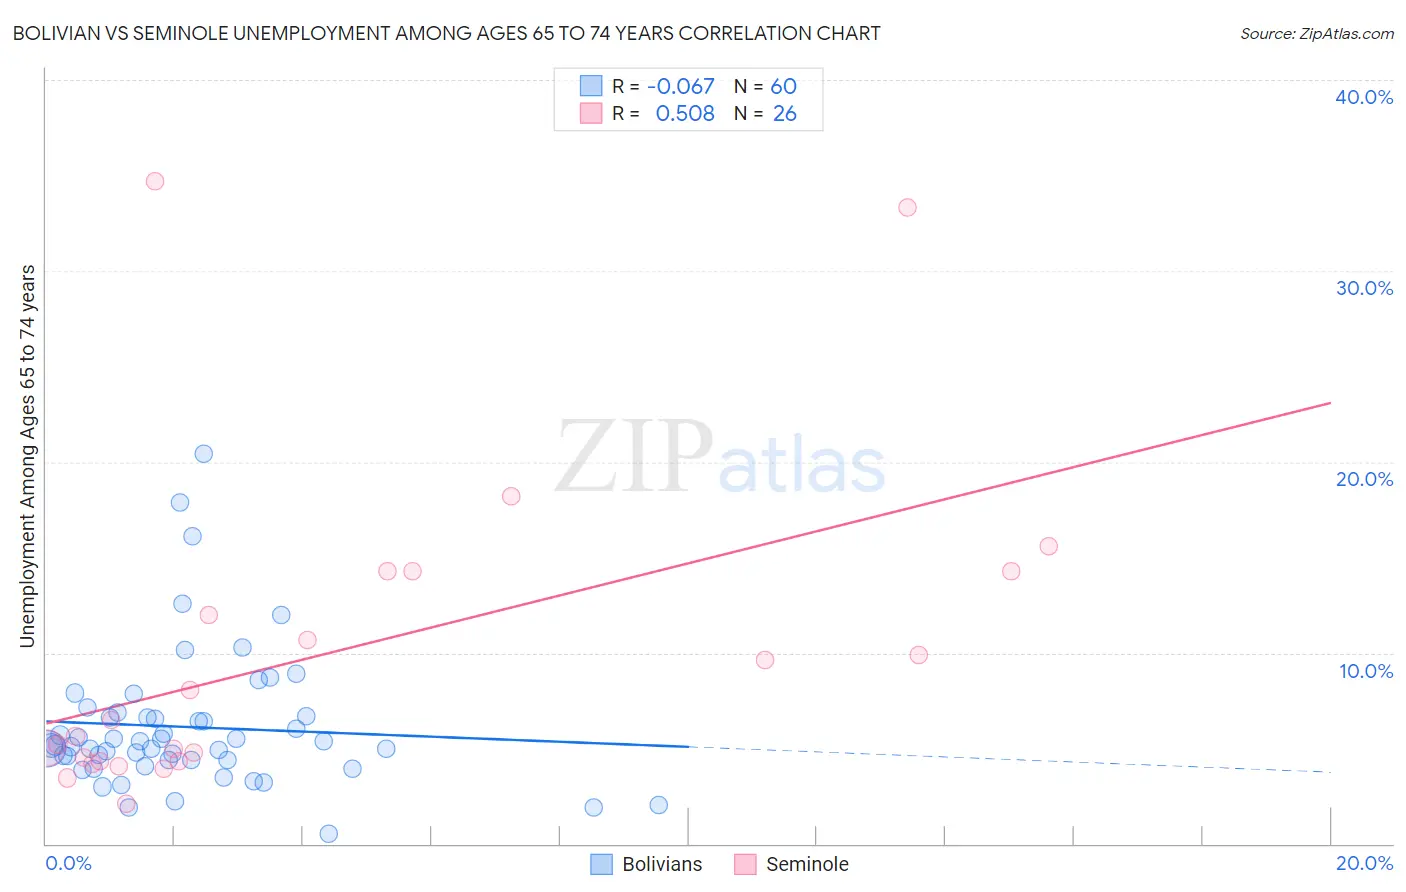
Bolivian vs Seminole Unemployment Among Ages 65 to 74 years Correlation Chart
The statistical analysis conducted on geographies consisting of 173,380,065 people shows a slight negative correlation between the proportion of Bolivians and unemployment rate among population between the ages 65 and 74 in the United States with a correlation coefficient (R) of -0.067 and weighted average of 5.1%. Similarly, the statistical analysis conducted on geographies consisting of 111,050,391 people shows a substantial positive correlation between the proportion of Seminole and unemployment rate among population between the ages 65 and 74 in the United States with a correlation coefficient (R) of 0.508 and weighted average of 5.4%, a difference of 5.8%.
Unemployment Among Ages 65 to 74 years Correlation Summary
| Measurement | Bolivian | Seminole |
| Minimum | 0.50% | 2.1% |
| Maximum | 20.4% | 34.7% |
| Range | 19.9% | 32.6% |
| Mean | 6.1% | 9.9% |
| Median | 5.1% | 6.0% |
| Interquartile 25% (IQ1) | 4.4% | 4.4% |
| Interquartile 75% (IQ3) | 6.6% | 14.3% |
| Interquartile Range (IQR) | 2.3% | 9.9% |
| Standard Deviation (Sample) | 3.6% | 8.4% |
| Standard Deviation (Population) | 3.6% | 8.2% |
Similar Demographics by Unemployment Among Ages 65 to 74 years
Demographics Similar to Bolivians by Unemployment Among Ages 65 to 74 years
In terms of unemployment among ages 65 to 74 years, the demographic groups most similar to Bolivians are Immigrants from Moldova (5.1%, a difference of 0.0%), Iroquois (5.1%, a difference of 0.040%), Kiowa (5.1%, a difference of 0.060%), Swiss (5.1%, a difference of 0.090%), and Latvian (5.1%, a difference of 0.090%).
| Demographics | Rating | Rank | Unemployment Among Ages 65 to 74 years |
| Germans | 99.5 /100 | #58 | Exceptional 5.1% |
| Immigrants | Bulgaria | 99.4 /100 | #59 | Exceptional 5.1% |
| Immigrants | Jordan | 99.4 /100 | #60 | Exceptional 5.1% |
| Immigrants | Taiwan | 99.4 /100 | #61 | Exceptional 5.1% |
| Nicaraguans | 99.4 /100 | #62 | Exceptional 5.1% |
| Kiowa | 99.3 /100 | #63 | Exceptional 5.1% |
| Immigrants | Moldova | 99.3 /100 | #64 | Exceptional 5.1% |
| Bolivians | 99.3 /100 | #65 | Exceptional 5.1% |
| Iroquois | 99.3 /100 | #66 | Exceptional 5.1% |
| Swiss | 99.2 /100 | #67 | Exceptional 5.1% |
| Latvians | 99.2 /100 | #68 | Exceptional 5.1% |
| Scandinavians | 99.1 /100 | #69 | Exceptional 5.2% |
| Immigrants | Japan | 99.1 /100 | #70 | Exceptional 5.2% |
| Scotch-Irish | 99.0 /100 | #71 | Exceptional 5.2% |
| Immigrants | Oceania | 99.0 /100 | #72 | Exceptional 5.2% |
Demographics Similar to Seminole by Unemployment Among Ages 65 to 74 years
In terms of unemployment among ages 65 to 74 years, the demographic groups most similar to Seminole are Subsaharan African (5.4%, a difference of 0.0%), Argentinean (5.4%, a difference of 0.0%), Icelander (5.4%, a difference of 0.010%), Immigrants from Western Asia (5.4%, a difference of 0.040%), and Immigrants from Pakistan (5.4%, a difference of 0.060%).
| Demographics | Rating | Rank | Unemployment Among Ages 65 to 74 years |
| Colville | 20.4 /100 | #197 | Fair 5.4% |
| Albanians | 17.8 /100 | #198 | Poor 5.4% |
| Immigrants | Belgium | 16.2 /100 | #199 | Poor 5.4% |
| Immigrants | Pakistan | 15.2 /100 | #200 | Poor 5.4% |
| Immigrants | Western Asia | 14.9 /100 | #201 | Poor 5.4% |
| Sub-Saharan Africans | 14.4 /100 | #202 | Poor 5.4% |
| Argentineans | 14.3 /100 | #203 | Poor 5.4% |
| Seminole | 14.3 /100 | #204 | Poor 5.4% |
| Icelanders | 14.2 /100 | #205 | Poor 5.4% |
| Africans | 12.8 /100 | #206 | Poor 5.5% |
| Immigrants | Uzbekistan | 12.5 /100 | #207 | Poor 5.5% |
| Dutch West Indians | 11.5 /100 | #208 | Poor 5.5% |
| Immigrants | Honduras | 10.4 /100 | #209 | Poor 5.5% |
| Immigrants | Northern Africa | 10.1 /100 | #210 | Poor 5.5% |
| Immigrants | Croatia | 9.1 /100 | #211 | Tragic 5.5% |