Bolivian vs Filipino Unemployment Among Seniors over 75 years
COMPARE
Bolivian
Filipino
Unemployment Among Seniors over 75 years
Unemployment Among Seniors over 75 years Comparison
Bolivians
Filipinos
8.0%
UNEMPLOYMENT AMONG SENIORS OVER 75 YEARS
99.9/ 100
METRIC RATING
72nd/ 347
METRIC RANK
7.9%
UNEMPLOYMENT AMONG SENIORS OVER 75 YEARS
99.9/ 100
METRIC RATING
55th/ 347
METRIC RANK
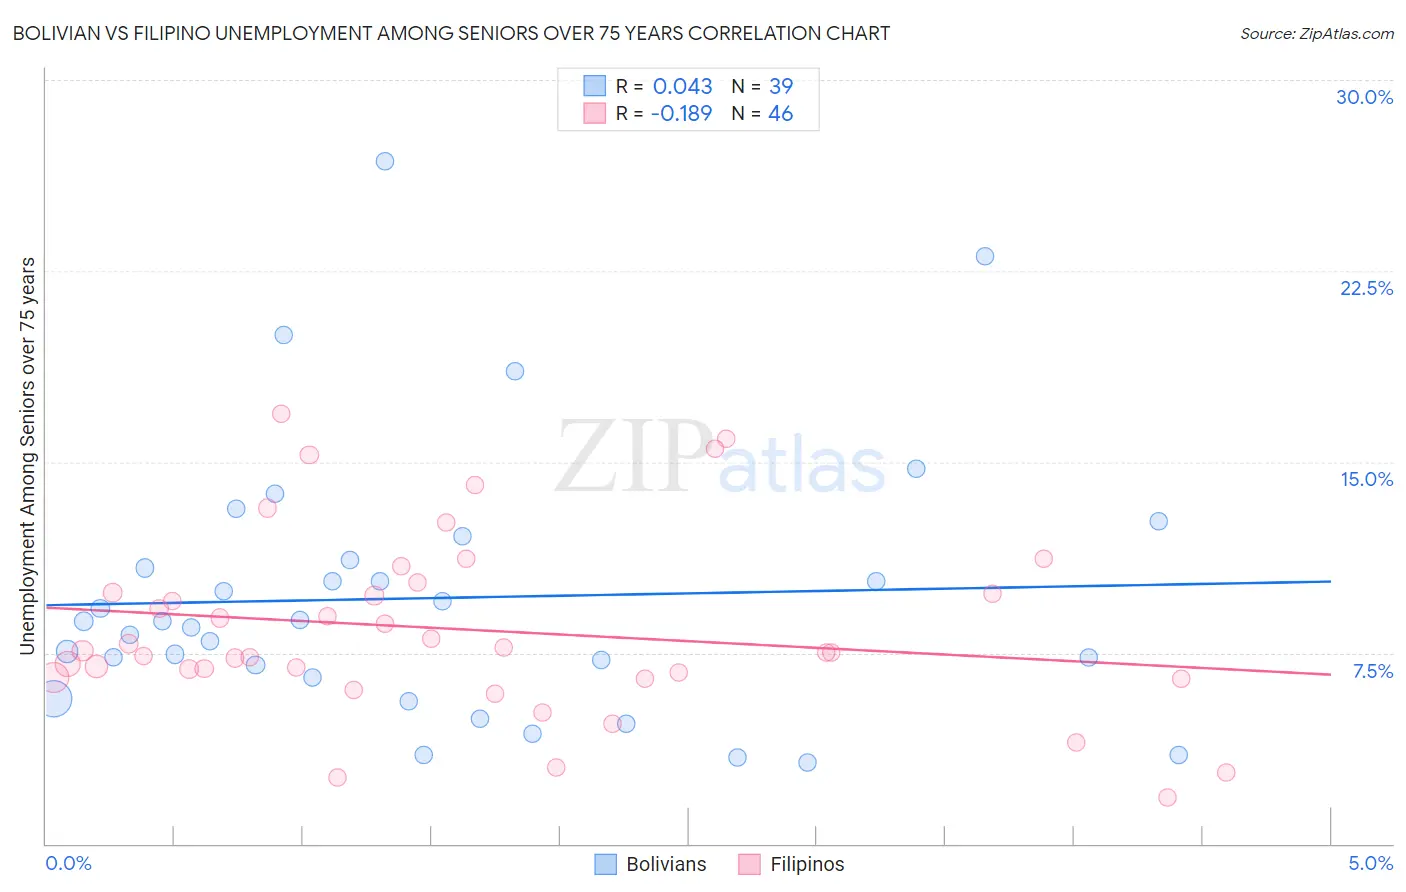
Bolivian vs Filipino Unemployment Among Seniors over 75 years Correlation Chart
The statistical analysis conducted on geographies consisting of 122,260,083 people shows no correlation between the proportion of Bolivians and unemployment rate among seniors over the age of 75 in the United States with a correlation coefficient (R) of 0.043 and weighted average of 8.0%. Similarly, the statistical analysis conducted on geographies consisting of 152,741,914 people shows a poor negative correlation between the proportion of Filipinos and unemployment rate among seniors over the age of 75 in the United States with a correlation coefficient (R) of -0.189 and weighted average of 7.9%, a difference of 1.3%.
Unemployment Among Seniors over 75 years Correlation Summary
| Measurement | Bolivian | Filipino |
| Minimum | 3.2% | 1.8% |
| Maximum | 26.8% | 16.9% |
| Range | 23.6% | 15.1% |
| Mean | 9.7% | 8.4% |
| Median | 8.7% | 7.5% |
| Interquartile 25% (IQ1) | 6.5% | 6.5% |
| Interquartile 75% (IQ3) | 11.2% | 9.9% |
| Interquartile Range (IQR) | 4.6% | 3.3% |
| Standard Deviation (Sample) | 5.3% | 3.5% |
| Standard Deviation (Population) | 5.2% | 3.5% |
Demographics Similar to Bolivians and Filipinos by Unemployment Among Seniors over 75 years
In terms of unemployment among seniors over 75 years, the demographic groups most similar to Bolivians are Immigrants from Cambodia (8.0%, a difference of 0.040%), Immigrants from France (8.0%, a difference of 0.040%), Immigrants from Argentina (8.0%, a difference of 0.11%), Indian (Asian) (8.0%, a difference of 0.19%), and Immigrants from South Africa (8.0%, a difference of 0.20%). Similarly, the demographic groups most similar to Filipinos are Immigrants from Eastern Asia (7.9%, a difference of 0.010%), Ottawa (7.9%, a difference of 0.18%), Iranian (7.9%, a difference of 0.23%), Immigrants from Malaysia (7.9%, a difference of 0.32%), and Immigrants from Egypt (7.9%, a difference of 0.36%).
| Demographics | Rating | Rank | Unemployment Among Seniors over 75 years |
| Immigrants | Egypt | 100.0 /100 | #53 | Exceptional 7.9% |
| Immigrants | Malaysia | 99.9 /100 | #54 | Exceptional 7.9% |
| Filipinos | 99.9 /100 | #55 | Exceptional 7.9% |
| Immigrants | Eastern Asia | 99.9 /100 | #56 | Exceptional 7.9% |
| Ottawa | 99.9 /100 | #57 | Exceptional 7.9% |
| Iranians | 99.9 /100 | #58 | Exceptional 7.9% |
| Indonesians | 99.9 /100 | #59 | Exceptional 7.9% |
| Immigrants | Morocco | 99.9 /100 | #60 | Exceptional 7.9% |
| Uruguayans | 99.9 /100 | #61 | Exceptional 7.9% |
| Immigrants | Albania | 99.9 /100 | #62 | Exceptional 7.9% |
| Immigrants | Nicaragua | 99.9 /100 | #63 | Exceptional 7.9% |
| Immigrants | Taiwan | 99.9 /100 | #64 | Exceptional 7.9% |
| Argentineans | 99.9 /100 | #65 | Exceptional 7.9% |
| Immigrants | Austria | 99.9 /100 | #66 | Exceptional 8.0% |
| Immigrants | Syria | 99.9 /100 | #67 | Exceptional 8.0% |
| Immigrants | South Africa | 99.9 /100 | #68 | Exceptional 8.0% |
| Indians (Asian) | 99.9 /100 | #69 | Exceptional 8.0% |
| Immigrants | Argentina | 99.9 /100 | #70 | Exceptional 8.0% |
| Immigrants | Cambodia | 99.9 /100 | #71 | Exceptional 8.0% |
| Bolivians | 99.9 /100 | #72 | Exceptional 8.0% |
| Immigrants | France | 99.9 /100 | #73 | Exceptional 8.0% |