Black/African American vs Guamanian/Chamorro Unemployment Among Ages 25 to 29 years
COMPARE
Black/African American
Guamanian/Chamorro
Unemployment Among Ages 25 to 29 years
Unemployment Among Ages 25 to 29 years Comparison
Blacks/African Americans
Guamanians/Chamorros
8.6%
UNEMPLOYMENT AMONG AGES 25 TO 29 YEARS
0.0/ 100
METRIC RATING
320th/ 347
METRIC RANK
6.8%
UNEMPLOYMENT AMONG AGES 25 TO 29 YEARS
24.3/ 100
METRIC RATING
199th/ 347
METRIC RANK
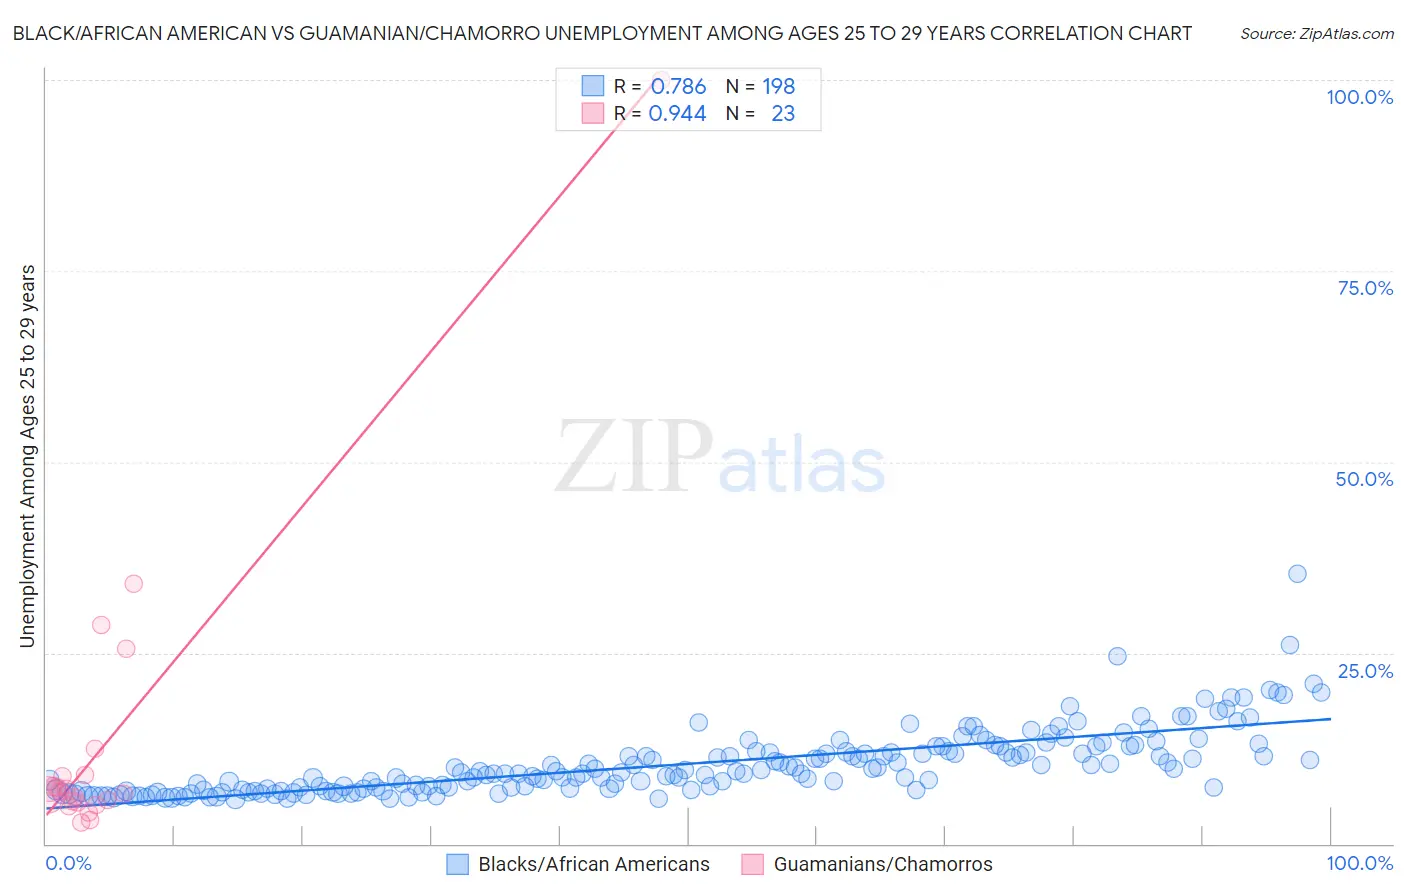
Black/African American vs Guamanian/Chamorro Unemployment Among Ages 25 to 29 years Correlation Chart
The statistical analysis conducted on geographies consisting of 507,749,487 people shows a strong positive correlation between the proportion of Blacks/African Americans and unemployment rate among population between the ages 25 and 29 in the United States with a correlation coefficient (R) of 0.786 and weighted average of 8.6%. Similarly, the statistical analysis conducted on geographies consisting of 216,987,101 people shows a near-perfect positive correlation between the proportion of Guamanians/Chamorros and unemployment rate among population between the ages 25 and 29 in the United States with a correlation coefficient (R) of 0.944 and weighted average of 6.8%, a difference of 26.6%.
Unemployment Among Ages 25 to 29 years Correlation Summary
| Measurement | Black/African American | Guamanian/Chamorro |
| Minimum | 5.8% | 2.8% |
| Maximum | 35.3% | 100.0% |
| Range | 29.5% | 97.2% |
| Mean | 10.4% | 13.5% |
| Median | 9.3% | 6.8% |
| Interquartile 25% (IQ1) | 7.1% | 5.4% |
| Interquartile 75% (IQ3) | 12.0% | 9.0% |
| Interquartile Range (IQR) | 5.0% | 3.5% |
| Standard Deviation (Sample) | 4.3% | 20.6% |
| Standard Deviation (Population) | 4.3% | 20.1% |
Similar Demographics by Unemployment Among Ages 25 to 29 years
Demographics Similar to Blacks/African Americans by Unemployment Among Ages 25 to 29 years
In terms of unemployment among ages 25 to 29 years, the demographic groups most similar to Blacks/African Americans are Immigrants from Dominican Republic (8.6%, a difference of 0.61%), Immigrants from Armenia (8.5%, a difference of 0.74%), Guyanese (8.5%, a difference of 0.97%), Immigrants from Guyana (8.5%, a difference of 1.2%), and Immigrants from Grenada (8.4%, a difference of 1.3%).
| Demographics | Rating | Rank | Unemployment Among Ages 25 to 29 years |
| Immigrants | St. Vincent and the Grenadines | 0.0 /100 | #313 | Tragic 8.4% |
| Immigrants | Dominica | 0.0 /100 | #314 | Tragic 8.4% |
| British West Indians | 0.0 /100 | #315 | Tragic 8.4% |
| Immigrants | Grenada | 0.0 /100 | #316 | Tragic 8.4% |
| Immigrants | Guyana | 0.0 /100 | #317 | Tragic 8.5% |
| Guyanese | 0.0 /100 | #318 | Tragic 8.5% |
| Immigrants | Armenia | 0.0 /100 | #319 | Tragic 8.5% |
| Blacks/African Americans | 0.0 /100 | #320 | Tragic 8.6% |
| Immigrants | Dominican Republic | 0.0 /100 | #321 | Tragic 8.6% |
| Tlingit-Haida | 0.0 /100 | #322 | Tragic 8.7% |
| Dominicans | 0.0 /100 | #323 | Tragic 8.7% |
| Houma | 0.0 /100 | #324 | Tragic 8.7% |
| Yakama | 0.0 /100 | #325 | Tragic 8.8% |
| Shoshone | 0.0 /100 | #326 | Tragic 9.2% |
| Colville | 0.0 /100 | #327 | Tragic 9.2% |
Demographics Similar to Guamanians/Chamorros by Unemployment Among Ages 25 to 29 years
In terms of unemployment among ages 25 to 29 years, the demographic groups most similar to Guamanians/Chamorros are Immigrants from Southern Europe (6.8%, a difference of 0.020%), South American Indian (6.8%, a difference of 0.080%), Basque (6.8%, a difference of 0.15%), Italian (6.8%, a difference of 0.18%), and Hungarian (6.8%, a difference of 0.20%).
| Demographics | Rating | Rank | Unemployment Among Ages 25 to 29 years |
| Immigrants | Ukraine | 28.6 /100 | #192 | Fair 6.7% |
| Alsatians | 28.1 /100 | #193 | Fair 6.7% |
| Immigrants | Greece | 28.0 /100 | #194 | Fair 6.7% |
| Immigrants | Western Asia | 27.3 /100 | #195 | Fair 6.7% |
| Hungarians | 26.8 /100 | #196 | Fair 6.8% |
| Italians | 26.5 /100 | #197 | Fair 6.8% |
| Immigrants | Southern Europe | 24.6 /100 | #198 | Fair 6.8% |
| Guamanians/Chamorros | 24.3 /100 | #199 | Fair 6.8% |
| South American Indians | 23.3 /100 | #200 | Fair 6.8% |
| Basques | 22.5 /100 | #201 | Fair 6.8% |
| Immigrants | Argentina | 21.6 /100 | #202 | Fair 6.8% |
| Immigrants | Norway | 21.2 /100 | #203 | Fair 6.8% |
| Scotch-Irish | 20.0 /100 | #204 | Poor 6.8% |
| Immigrants | England | 19.8 /100 | #205 | Poor 6.8% |
| Ugandans | 19.8 /100 | #206 | Poor 6.8% |