Blackfeet vs Puget Sound Salish Unemployment Among Ages 55 to 59 years
COMPARE
Blackfeet
Puget Sound Salish
Unemployment Among Ages 55 to 59 years
Unemployment Among Ages 55 to 59 years Comparison
Blackfeet
Puget Sound Salish
5.1%
UNEMPLOYMENT AMONG AGES 55 TO 59 YEARS
0.3/ 100
METRIC RATING
255th/ 347
METRIC RANK
4.4%
UNEMPLOYMENT AMONG AGES 55 TO 59 YEARS
100.0/ 100
METRIC RATING
21st/ 347
METRIC RANK
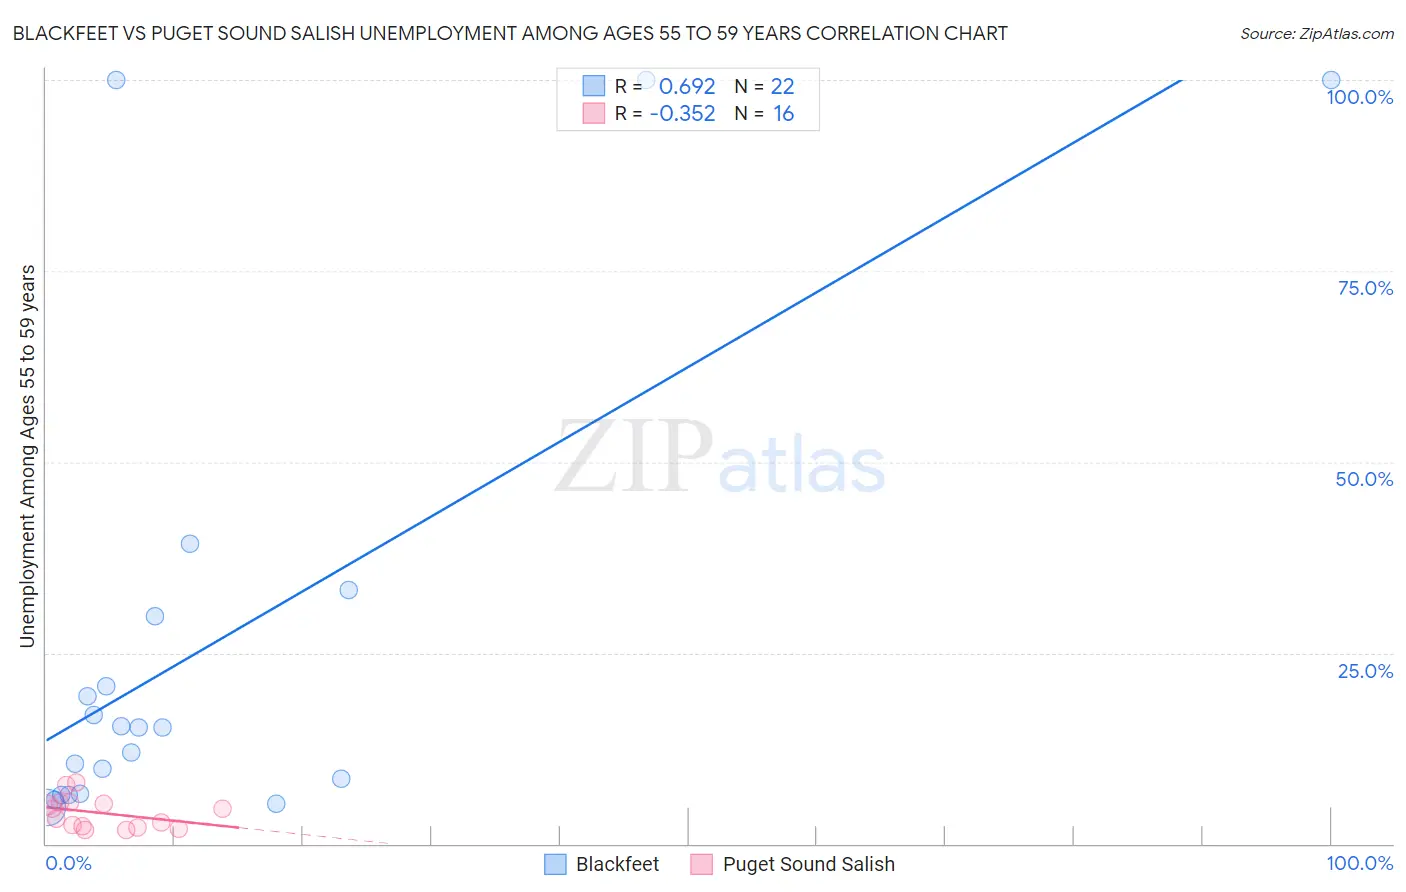
Blackfeet vs Puget Sound Salish Unemployment Among Ages 55 to 59 years Correlation Chart
The statistical analysis conducted on geographies consisting of 289,110,116 people shows a significant positive correlation between the proportion of Blackfeet and unemployment rate among population between the ages 55 and 59 in the United States with a correlation coefficient (R) of 0.692 and weighted average of 5.1%. Similarly, the statistical analysis conducted on geographies consisting of 44,647,862 people shows a mild negative correlation between the proportion of Puget Sound Salish and unemployment rate among population between the ages 55 and 59 in the United States with a correlation coefficient (R) of -0.352 and weighted average of 4.4%, a difference of 15.6%.
Unemployment Among Ages 55 to 59 years Correlation Summary
| Measurement | Blackfeet | Puget Sound Salish |
| Minimum | 4.7% | 1.8% |
| Maximum | 100.0% | 8.0% |
| Range | 95.3% | 6.2% |
| Mean | 26.4% | 4.0% |
| Median | 15.2% | 3.9% |
| Interquartile 25% (IQ1) | 6.6% | 2.2% |
| Interquartile 75% (IQ3) | 29.8% | 5.3% |
| Interquartile Range (IQR) | 23.2% | 3.1% |
| Standard Deviation (Sample) | 31.3% | 2.0% |
| Standard Deviation (Population) | 30.6% | 2.0% |
Similar Demographics by Unemployment Among Ages 55 to 59 years
Demographics Similar to Blackfeet by Unemployment Among Ages 55 to 59 years
In terms of unemployment among ages 55 to 59 years, the demographic groups most similar to Blackfeet are Seminole (5.1%, a difference of 0.070%), Paraguayan (5.1%, a difference of 0.10%), Senegalese (5.1%, a difference of 0.11%), U.S. Virgin Islander (5.1%, a difference of 0.14%), and Portuguese (5.1%, a difference of 0.16%).
| Demographics | Rating | Rank | Unemployment Among Ages 55 to 59 years |
| Native Hawaiians | 0.5 /100 | #248 | Tragic 5.1% |
| Comanche | 0.4 /100 | #249 | Tragic 5.1% |
| Cheyenne | 0.4 /100 | #250 | Tragic 5.1% |
| Portuguese | 0.3 /100 | #251 | Tragic 5.1% |
| U.S. Virgin Islanders | 0.3 /100 | #252 | Tragic 5.1% |
| Paraguayans | 0.3 /100 | #253 | Tragic 5.1% |
| Seminole | 0.3 /100 | #254 | Tragic 5.1% |
| Blackfeet | 0.3 /100 | #255 | Tragic 5.1% |
| Senegalese | 0.3 /100 | #256 | Tragic 5.1% |
| Central Americans | 0.2 /100 | #257 | Tragic 5.1% |
| Salvadorans | 0.2 /100 | #258 | Tragic 5.1% |
| Immigrants | West Indies | 0.2 /100 | #259 | Tragic 5.1% |
| Immigrants | Western Africa | 0.2 /100 | #260 | Tragic 5.1% |
| Africans | 0.1 /100 | #261 | Tragic 5.1% |
| Immigrants | El Salvador | 0.1 /100 | #262 | Tragic 5.1% |
Demographics Similar to Puget Sound Salish by Unemployment Among Ages 55 to 59 years
In terms of unemployment among ages 55 to 59 years, the demographic groups most similar to Puget Sound Salish are Immigrants from Burma/Myanmar (4.4%, a difference of 0.090%), Swedish (4.4%, a difference of 0.15%), Chinese (4.4%, a difference of 0.28%), Kenyan (4.4%, a difference of 0.35%), and Immigrants from Somalia (4.4%, a difference of 0.37%).
| Demographics | Rating | Rank | Unemployment Among Ages 55 to 59 years |
| Immigrants | India | 100.0 /100 | #14 | Exceptional 4.3% |
| Bulgarians | 100.0 /100 | #15 | Exceptional 4.3% |
| Somalis | 100.0 /100 | #16 | Exceptional 4.4% |
| Czechs | 100.0 /100 | #17 | Exceptional 4.4% |
| Immigrants | Somalia | 100.0 /100 | #18 | Exceptional 4.4% |
| Chinese | 100.0 /100 | #19 | Exceptional 4.4% |
| Swedes | 100.0 /100 | #20 | Exceptional 4.4% |
| Puget Sound Salish | 100.0 /100 | #21 | Exceptional 4.4% |
| Immigrants | Burma/Myanmar | 100.0 /100 | #22 | Exceptional 4.4% |
| Kenyans | 100.0 /100 | #23 | Exceptional 4.4% |
| Jordanians | 100.0 /100 | #24 | Exceptional 4.4% |
| Immigrants | Eritrea | 100.0 /100 | #25 | Exceptional 4.4% |
| Scandinavians | 99.9 /100 | #26 | Exceptional 4.5% |
| Immigrants | Zimbabwe | 99.9 /100 | #27 | Exceptional 4.5% |
| Immigrants | Eastern Africa | 99.9 /100 | #28 | Exceptional 4.5% |