Blackfeet vs Bangladeshi Unemployment Among Seniors over 75 years
COMPARE
Blackfeet
Bangladeshi
Unemployment Among Seniors over 75 years
Unemployment Among Seniors over 75 years Comparison
Blackfeet
Bangladeshis
9.2%
UNEMPLOYMENT AMONG SENIORS OVER 75 YEARS
2.3/ 100
METRIC RATING
248th/ 347
METRIC RANK
9.6%
UNEMPLOYMENT AMONG SENIORS OVER 75 YEARS
0.1/ 100
METRIC RATING
281st/ 347
METRIC RANK
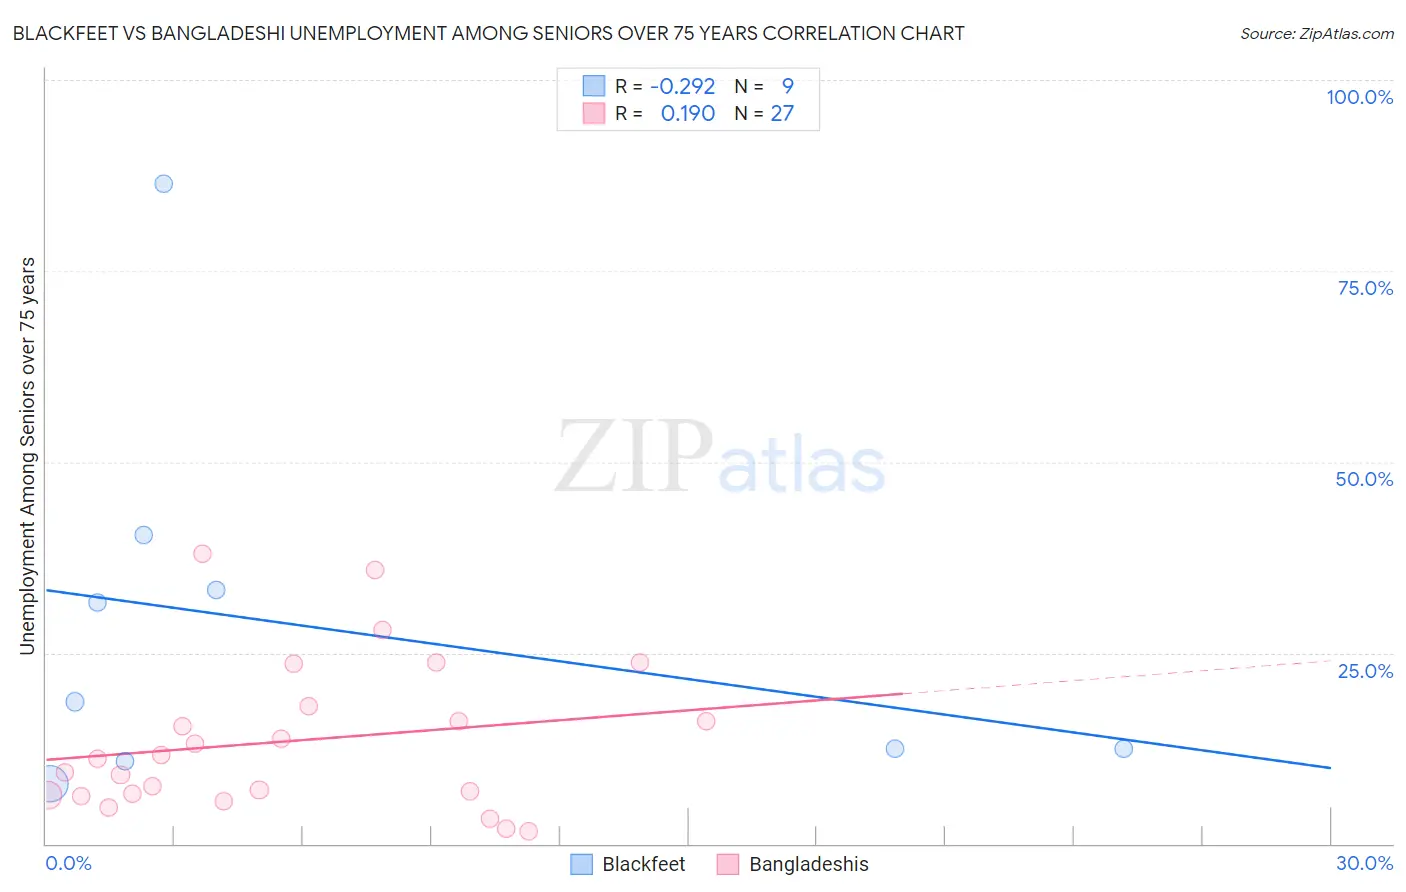
Blackfeet vs Bangladeshi Unemployment Among Seniors over 75 years Correlation Chart
The statistical analysis conducted on geographies consisting of 166,143,753 people shows a weak negative correlation between the proportion of Blackfeet and unemployment rate among seniors over the age of 75 in the United States with a correlation coefficient (R) of -0.292 and weighted average of 9.2%. Similarly, the statistical analysis conducted on geographies consisting of 94,162,163 people shows a poor positive correlation between the proportion of Bangladeshis and unemployment rate among seniors over the age of 75 in the United States with a correlation coefficient (R) of 0.190 and weighted average of 9.6%, a difference of 4.6%.
Unemployment Among Seniors over 75 years Correlation Summary
| Measurement | Blackfeet | Bangladeshi |
| Minimum | 7.9% | 1.7% |
| Maximum | 86.4% | 38.0% |
| Range | 78.5% | 36.3% |
| Mean | 28.2% | 13.5% |
| Median | 18.6% | 11.1% |
| Interquartile 25% (IQ1) | 11.6% | 6.4% |
| Interquartile 75% (IQ3) | 36.9% | 18.0% |
| Interquartile Range (IQR) | 25.3% | 11.6% |
| Standard Deviation (Sample) | 24.7% | 9.8% |
| Standard Deviation (Population) | 23.3% | 9.6% |
Similar Demographics by Unemployment Among Seniors over 75 years
Demographics Similar to Blackfeet by Unemployment Among Seniors over 75 years
In terms of unemployment among seniors over 75 years, the demographic groups most similar to Blackfeet are Subsaharan African (9.2%, a difference of 0.040%), Immigrants from Saudi Arabia (9.2%, a difference of 0.050%), Immigrants from North America (9.2%, a difference of 0.060%), Central American Indian (9.2%, a difference of 0.060%), and Immigrants from Poland (9.2%, a difference of 0.15%).
| Demographics | Rating | Rank | Unemployment Among Seniors over 75 years |
| Immigrants | Southern Europe | 2.8 /100 | #241 | Tragic 9.2% |
| Sierra Leoneans | 2.8 /100 | #242 | Tragic 9.2% |
| Slavs | 2.8 /100 | #243 | Tragic 9.2% |
| Immigrants | Germany | 2.7 /100 | #244 | Tragic 9.2% |
| Immigrants | Canada | 2.6 /100 | #245 | Tragic 9.2% |
| Immigrants | North America | 2.4 /100 | #246 | Tragic 9.2% |
| Sub-Saharan Africans | 2.3 /100 | #247 | Tragic 9.2% |
| Blackfeet | 2.3 /100 | #248 | Tragic 9.2% |
| Immigrants | Saudi Arabia | 2.2 /100 | #249 | Tragic 9.2% |
| Central American Indians | 2.2 /100 | #250 | Tragic 9.2% |
| Immigrants | Poland | 2.0 /100 | #251 | Tragic 9.2% |
| Immigrants | Sudan | 2.0 /100 | #252 | Tragic 9.2% |
| Pima | 1.8 /100 | #253 | Tragic 9.2% |
| Immigrants | Ghana | 1.7 /100 | #254 | Tragic 9.2% |
| Immigrants | Scotland | 1.4 /100 | #255 | Tragic 9.2% |
Demographics Similar to Bangladeshis by Unemployment Among Seniors over 75 years
In terms of unemployment among seniors over 75 years, the demographic groups most similar to Bangladeshis are Croatian (9.6%, a difference of 0.16%), British (9.6%, a difference of 0.30%), Macedonian (9.6%, a difference of 0.34%), Immigrants from Nigeria (9.6%, a difference of 0.38%), and Immigrants from Senegal (9.6%, a difference of 0.45%).
| Demographics | Rating | Rank | Unemployment Among Seniors over 75 years |
| Jamaicans | 0.2 /100 | #274 | Tragic 9.5% |
| Senegalese | 0.2 /100 | #275 | Tragic 9.5% |
| Arabs | 0.2 /100 | #276 | Tragic 9.5% |
| Swiss | 0.1 /100 | #277 | Tragic 9.5% |
| Immigrants | Senegal | 0.1 /100 | #278 | Tragic 9.6% |
| British | 0.1 /100 | #279 | Tragic 9.6% |
| Croatians | 0.1 /100 | #280 | Tragic 9.6% |
| Bangladeshis | 0.1 /100 | #281 | Tragic 9.6% |
| Macedonians | 0.0 /100 | #282 | Tragic 9.6% |
| Immigrants | Nigeria | 0.0 /100 | #283 | Tragic 9.6% |
| Europeans | 0.0 /100 | #284 | Tragic 9.7% |
| Carpatho Rusyns | 0.0 /100 | #285 | Tragic 9.7% |
| Nigerians | 0.0 /100 | #286 | Tragic 9.7% |
| Danes | 0.0 /100 | #287 | Tragic 9.7% |
| Canadians | 0.0 /100 | #288 | Tragic 9.7% |