Bhutanese vs Slovene Unemployment Among Ages 45 to 54 years
COMPARE
Bhutanese
Slovene
Unemployment Among Ages 45 to 54 years
Unemployment Among Ages 45 to 54 years Comparison
Bhutanese
Slovenes
4.2%
UNEMPLOYMENT AMONG AGES 45 TO 54 YEARS
99.9/ 100
METRIC RATING
31st/ 347
METRIC RANK
4.2%
UNEMPLOYMENT AMONG AGES 45 TO 54 YEARS
99.9/ 100
METRIC RATING
32nd/ 347
METRIC RANK
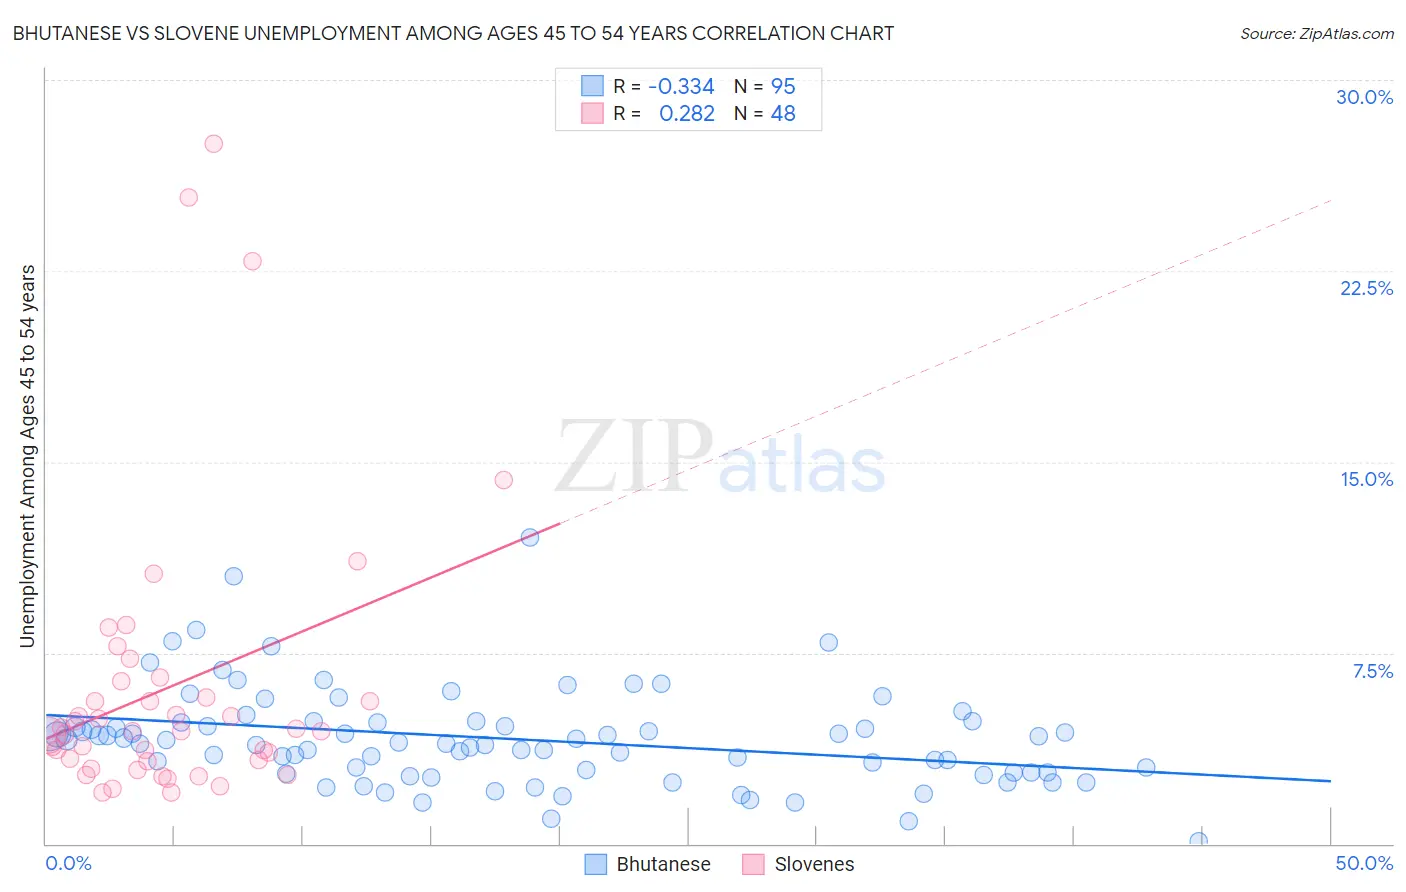
Bhutanese vs Slovene Unemployment Among Ages 45 to 54 years Correlation Chart
The statistical analysis conducted on geographies consisting of 440,206,537 people shows a mild negative correlation between the proportion of Bhutanese and unemployment rate among population between the ages 45 and 54 in the United States with a correlation coefficient (R) of -0.334 and weighted average of 4.2%. Similarly, the statistical analysis conducted on geographies consisting of 255,641,868 people shows a weak positive correlation between the proportion of Slovenes and unemployment rate among population between the ages 45 and 54 in the United States with a correlation coefficient (R) of 0.282 and weighted average of 4.2%, a difference of 0.11%.
Unemployment Among Ages 45 to 54 years Correlation Summary
| Measurement | Bhutanese | Slovene |
| Minimum | 0.10% | 2.0% |
| Maximum | 12.1% | 27.5% |
| Range | 12.0% | 25.5% |
| Mean | 4.1% | 6.1% |
| Median | 4.0% | 4.4% |
| Interquartile 25% (IQ1) | 2.8% | 3.3% |
| Interquartile 75% (IQ3) | 4.8% | 6.0% |
| Interquartile Range (IQR) | 2.0% | 2.8% |
| Standard Deviation (Sample) | 1.9% | 5.6% |
| Standard Deviation (Population) | 1.9% | 5.5% |
Demographics Similar to Bhutanese and Slovenes by Unemployment Among Ages 45 to 54 years
In terms of unemployment among ages 45 to 54 years, the demographic groups most similar to Bhutanese are British (4.1%, a difference of 0.020%), Belgian (4.1%, a difference of 0.030%), Immigrants from South Central Asia (4.2%, a difference of 0.13%), Welsh (4.1%, a difference of 0.17%), and Immigrants from Moldova (4.1%, a difference of 0.23%). Similarly, the demographic groups most similar to Slovenes are Immigrants from South Central Asia (4.2%, a difference of 0.020%), British (4.1%, a difference of 0.13%), Belgian (4.1%, a difference of 0.14%), Welsh (4.1%, a difference of 0.28%), and Immigrants from Moldova (4.1%, a difference of 0.34%).
| Demographics | Rating | Rank | Unemployment Among Ages 45 to 54 years |
| Europeans | 100.0 /100 | #21 | Exceptional 4.1% |
| Yugoslavians | 100.0 /100 | #22 | Exceptional 4.1% |
| Bulgarians | 100.0 /100 | #23 | Exceptional 4.1% |
| Carpatho Rusyns | 100.0 /100 | #24 | Exceptional 4.1% |
| Bolivians | 99.9 /100 | #25 | Exceptional 4.1% |
| Scottish | 99.9 /100 | #26 | Exceptional 4.1% |
| Immigrants | Moldova | 99.9 /100 | #27 | Exceptional 4.1% |
| Welsh | 99.9 /100 | #28 | Exceptional 4.1% |
| Belgians | 99.9 /100 | #29 | Exceptional 4.1% |
| British | 99.9 /100 | #30 | Exceptional 4.1% |
| Bhutanese | 99.9 /100 | #31 | Exceptional 4.2% |
| Slovenes | 99.9 /100 | #32 | Exceptional 4.2% |
| Immigrants | South Central Asia | 99.9 /100 | #33 | Exceptional 4.2% |
| Dutch | 99.9 /100 | #34 | Exceptional 4.2% |
| Immigrants | Taiwan | 99.8 /100 | #35 | Exceptional 4.2% |
| Croatians | 99.8 /100 | #36 | Exceptional 4.2% |
| Osage | 99.8 /100 | #37 | Exceptional 4.2% |
| Scotch-Irish | 99.8 /100 | #38 | Exceptional 4.2% |
| Jordanians | 99.8 /100 | #39 | Exceptional 4.2% |
| Northern Europeans | 99.8 /100 | #40 | Exceptional 4.2% |
| Czechoslovakians | 99.8 /100 | #41 | Exceptional 4.2% |