Bhutanese vs Shoshone Unemployment Among Youth under 25 years
COMPARE
Bhutanese
Shoshone
Unemployment Among Youth under 25 years
Unemployment Among Youth under 25 years Comparison
Bhutanese
Shoshone
11.2%
UNEMPLOYMENT AMONG YOUTH UNDER 25 YEARS
97.4/ 100
METRIC RATING
71st/ 347
METRIC RANK
13.7%
UNEMPLOYMENT AMONG YOUTH UNDER 25 YEARS
0.0/ 100
METRIC RATING
298th/ 347
METRIC RANK
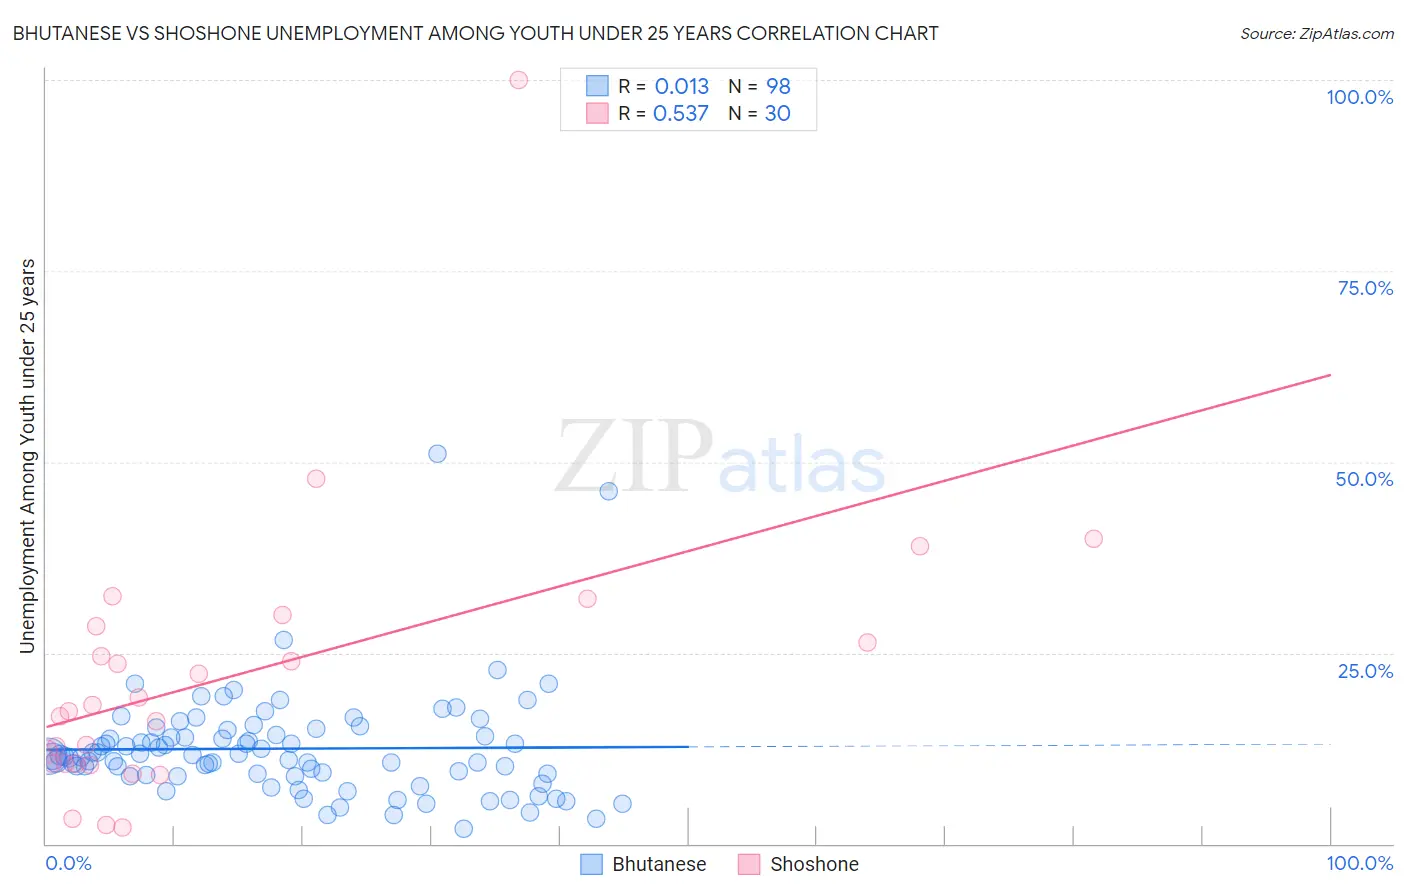
Bhutanese vs Shoshone Unemployment Among Youth under 25 years Correlation Chart
The statistical analysis conducted on geographies consisting of 448,134,198 people shows no correlation between the proportion of Bhutanese and unemployment rate among youth under the age of 25 in the United States with a correlation coefficient (R) of 0.013 and weighted average of 11.2%. Similarly, the statistical analysis conducted on geographies consisting of 66,364,189 people shows a substantial positive correlation between the proportion of Shoshone and unemployment rate among youth under the age of 25 in the United States with a correlation coefficient (R) of 0.537 and weighted average of 13.7%, a difference of 23.0%.
Unemployment Among Youth under 25 years Correlation Summary
| Measurement | Bhutanese | Shoshone |
| Minimum | 2.0% | 2.1% |
| Maximum | 51.1% | 100.0% |
| Range | 49.1% | 97.9% |
| Mean | 12.4% | 22.1% |
| Median | 11.5% | 17.7% |
| Interquartile 25% (IQ1) | 9.1% | 10.5% |
| Interquartile 75% (IQ3) | 14.2% | 28.5% |
| Interquartile Range (IQR) | 5.2% | 18.0% |
| Standard Deviation (Sample) | 7.0% | 18.7% |
| Standard Deviation (Population) | 7.0% | 18.3% |
Similar Demographics by Unemployment Among Youth under 25 years
Demographics Similar to Bhutanese by Unemployment Among Youth under 25 years
In terms of unemployment among youth under 25 years, the demographic groups most similar to Bhutanese are Immigrants from Moldova (11.2%, a difference of 0.040%), Slavic (11.2%, a difference of 0.040%), Immigrants from Australia (11.2%, a difference of 0.040%), Immigrants from Kenya (11.2%, a difference of 0.090%), and Creek (11.2%, a difference of 0.090%).
| Demographics | Rating | Rank | Unemployment Among Youth under 25 years |
| Jordanians | 97.9 /100 | #64 | Exceptional 11.1% |
| Immigrants | Singapore | 97.8 /100 | #65 | Exceptional 11.2% |
| Macedonians | 97.7 /100 | #66 | Exceptional 11.2% |
| Chickasaw | 97.7 /100 | #67 | Exceptional 11.2% |
| Immigrants | Kenya | 97.6 /100 | #68 | Exceptional 11.2% |
| Immigrants | Moldova | 97.5 /100 | #69 | Exceptional 11.2% |
| Slavs | 97.5 /100 | #70 | Exceptional 11.2% |
| Bhutanese | 97.4 /100 | #71 | Exceptional 11.2% |
| Immigrants | Australia | 97.3 /100 | #72 | Exceptional 11.2% |
| Creek | 97.2 /100 | #73 | Exceptional 11.2% |
| New Zealanders | 97.2 /100 | #74 | Exceptional 11.2% |
| French | 97.1 /100 | #75 | Exceptional 11.2% |
| German Russians | 97.0 /100 | #76 | Exceptional 11.2% |
| Whites/Caucasians | 96.9 /100 | #77 | Exceptional 11.2% |
| Immigrants | Nicaragua | 96.7 /100 | #78 | Exceptional 11.2% |
Demographics Similar to Shoshone by Unemployment Among Youth under 25 years
In terms of unemployment among youth under 25 years, the demographic groups most similar to Shoshone are Tohono O'odham (13.8%, a difference of 0.22%), Immigrants from Cabo Verde (13.8%, a difference of 0.43%), Immigrants from Senegal (13.8%, a difference of 0.60%), Immigrants from Sierra Leone (13.8%, a difference of 0.65%), and Belizean (13.8%, a difference of 0.68%).
| Demographics | Rating | Rank | Unemployment Among Youth under 25 years |
| Apache | 0.0 /100 | #291 | Tragic 13.5% |
| Central American Indians | 0.0 /100 | #292 | Tragic 13.5% |
| Spanish American Indians | 0.0 /100 | #293 | Tragic 13.5% |
| Immigrants | Caribbean | 0.0 /100 | #294 | Tragic 13.5% |
| Chippewa | 0.0 /100 | #295 | Tragic 13.5% |
| Senegalese | 0.0 /100 | #296 | Tragic 13.5% |
| U.S. Virgin Islanders | 0.0 /100 | #297 | Tragic 13.6% |
| Shoshone | 0.0 /100 | #298 | Tragic 13.7% |
| Tohono O'odham | 0.0 /100 | #299 | Tragic 13.8% |
| Immigrants | Cabo Verde | 0.0 /100 | #300 | Tragic 13.8% |
| Immigrants | Senegal | 0.0 /100 | #301 | Tragic 13.8% |
| Immigrants | Sierra Leone | 0.0 /100 | #302 | Tragic 13.8% |
| Belizeans | 0.0 /100 | #303 | Tragic 13.8% |
| Houma | 0.0 /100 | #304 | Tragic 13.8% |
| Haitians | 0.0 /100 | #305 | Tragic 13.9% |