Bhutanese vs Puerto Rican Unemployment Among Ages 55 to 59 years
COMPARE
Bhutanese
Puerto Rican
Unemployment Among Ages 55 to 59 years
Unemployment Among Ages 55 to 59 years Comparison
Bhutanese
Puerto Ricans
4.6%
UNEMPLOYMENT AMONG AGES 55 TO 59 YEARS
98.6/ 100
METRIC RATING
73rd/ 347
METRIC RANK
7.0%
UNEMPLOYMENT AMONG AGES 55 TO 59 YEARS
0.0/ 100
METRIC RATING
339th/ 347
METRIC RANK
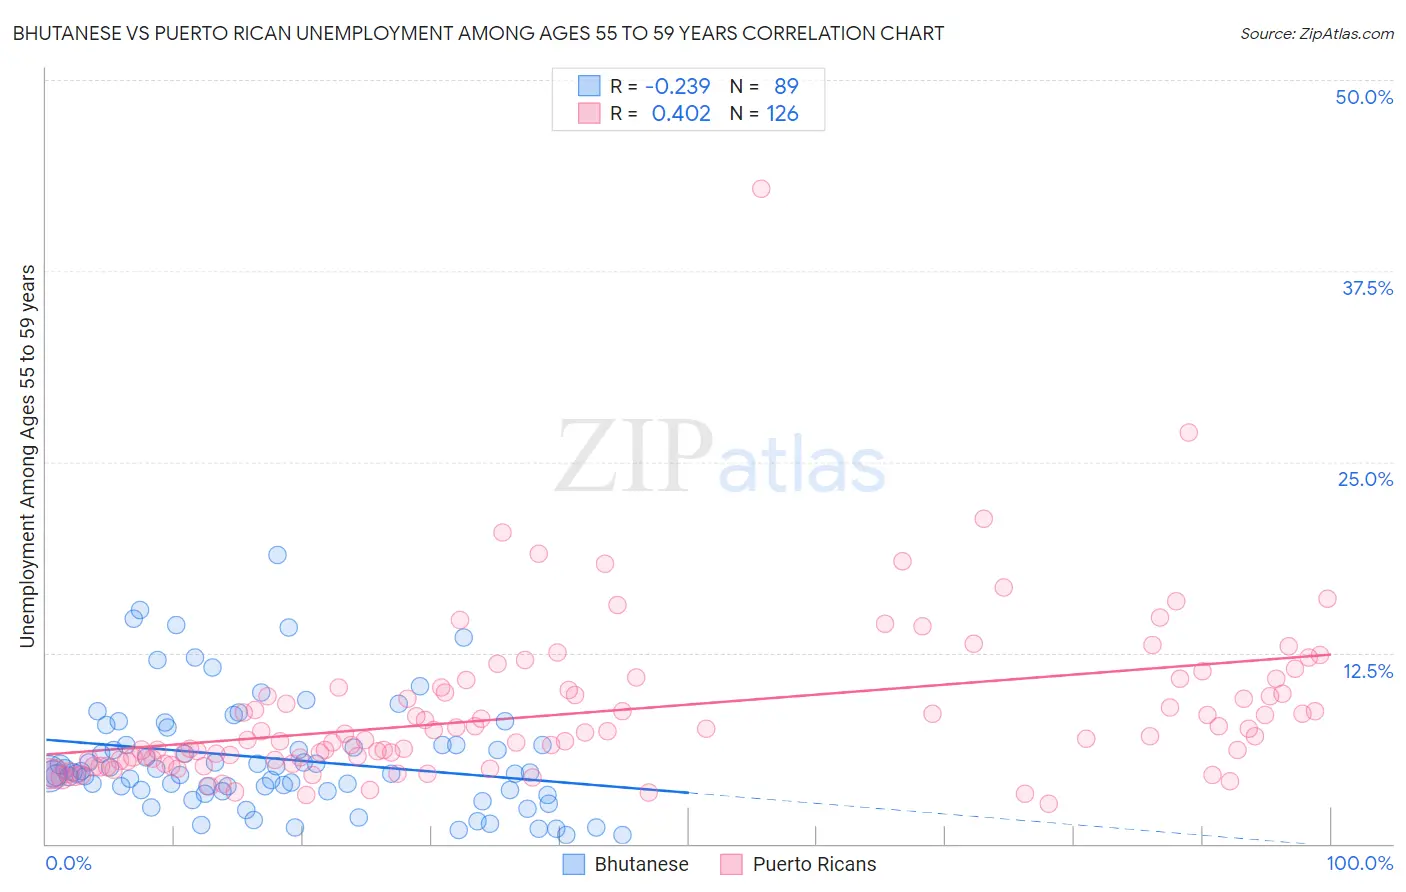
Bhutanese vs Puerto Rican Unemployment Among Ages 55 to 59 years Correlation Chart
The statistical analysis conducted on geographies consisting of 415,773,298 people shows a weak negative correlation between the proportion of Bhutanese and unemployment rate among population between the ages 55 and 59 in the United States with a correlation coefficient (R) of -0.239 and weighted average of 4.6%. Similarly, the statistical analysis conducted on geographies consisting of 468,874,037 people shows a moderate positive correlation between the proportion of Puerto Ricans and unemployment rate among population between the ages 55 and 59 in the United States with a correlation coefficient (R) of 0.402 and weighted average of 7.0%, a difference of 51.0%.
Unemployment Among Ages 55 to 59 years Correlation Summary
| Measurement | Bhutanese | Puerto Rican |
| Minimum | 0.60% | 2.6% |
| Maximum | 18.9% | 42.9% |
| Range | 18.3% | 40.3% |
| Mean | 5.6% | 8.6% |
| Median | 4.7% | 7.0% |
| Interquartile 25% (IQ1) | 3.5% | 5.4% |
| Interquartile 75% (IQ3) | 6.5% | 10.1% |
| Interquartile Range (IQR) | 3.0% | 4.7% |
| Standard Deviation (Sample) | 3.7% | 5.2% |
| Standard Deviation (Population) | 3.6% | 5.2% |
Similar Demographics by Unemployment Among Ages 55 to 59 years
Demographics Similar to Bhutanese by Unemployment Among Ages 55 to 59 years
In terms of unemployment among ages 55 to 59 years, the demographic groups most similar to Bhutanese are Immigrants from Taiwan (4.6%, a difference of 0.080%), Croatian (4.6%, a difference of 0.080%), Immigrants from Iraq (4.6%, a difference of 0.090%), Immigrants from Jordan (4.6%, a difference of 0.11%), and Filipino (4.6%, a difference of 0.14%).
| Demographics | Rating | Rank | Unemployment Among Ages 55 to 59 years |
| Mongolians | 99.0 /100 | #66 | Exceptional 4.6% |
| Ugandans | 99.0 /100 | #67 | Exceptional 4.6% |
| Immigrants | Micronesia | 99.0 /100 | #68 | Exceptional 4.6% |
| Czechoslovakians | 99.0 /100 | #69 | Exceptional 4.6% |
| Filipinos | 98.8 /100 | #70 | Exceptional 4.6% |
| Immigrants | Jordan | 98.7 /100 | #71 | Exceptional 4.6% |
| Immigrants | Taiwan | 98.7 /100 | #72 | Exceptional 4.6% |
| Bhutanese | 98.6 /100 | #73 | Exceptional 4.6% |
| Croatians | 98.5 /100 | #74 | Exceptional 4.6% |
| Immigrants | Iraq | 98.5 /100 | #75 | Exceptional 4.6% |
| Immigrants | Bosnia and Herzegovina | 98.3 /100 | #76 | Exceptional 4.6% |
| Scotch-Irish | 98.3 /100 | #77 | Exceptional 4.6% |
| Finns | 98.2 /100 | #78 | Exceptional 4.6% |
| Sri Lankans | 98.1 /100 | #79 | Exceptional 4.6% |
| Cambodians | 98.0 /100 | #80 | Exceptional 4.6% |
Demographics Similar to Puerto Ricans by Unemployment Among Ages 55 to 59 years
In terms of unemployment among ages 55 to 59 years, the demographic groups most similar to Puerto Ricans are Immigrants from Yemen (6.9%, a difference of 1.1%), Alaskan Athabascan (7.1%, a difference of 2.5%), Paiute (6.8%, a difference of 3.0%), Navajo (6.7%, a difference of 3.6%), and Colville (6.7%, a difference of 3.7%).
| Demographics | Rating | Rank | Unemployment Among Ages 55 to 59 years |
| Aleuts | 0.0 /100 | #332 | Tragic 6.4% |
| Pima | 0.0 /100 | #333 | Tragic 6.6% |
| Pueblo | 0.0 /100 | #334 | Tragic 6.7% |
| Colville | 0.0 /100 | #335 | Tragic 6.7% |
| Navajo | 0.0 /100 | #336 | Tragic 6.7% |
| Paiute | 0.0 /100 | #337 | Tragic 6.8% |
| Immigrants | Yemen | 0.0 /100 | #338 | Tragic 6.9% |
| Puerto Ricans | 0.0 /100 | #339 | Tragic 7.0% |
| Alaskan Athabascans | 0.0 /100 | #340 | Tragic 7.1% |
| Shoshone | 0.0 /100 | #341 | Tragic 7.4% |
| Hopi | 0.0 /100 | #342 | Tragic 8.1% |
| Yakama | 0.0 /100 | #343 | Tragic 8.9% |
| Inupiat | 0.0 /100 | #344 | Tragic 9.0% |
| Tohono O'odham | 0.0 /100 | #345 | Tragic 9.3% |
| Menominee | 0.0 /100 | #346 | Tragic 10.5% |