Bhutanese vs Immigrants from Asia Unemployment Among Ages 65 to 74 years
COMPARE
Bhutanese
Immigrants from Asia
Unemployment Among Ages 65 to 74 years
Unemployment Among Ages 65 to 74 years Comparison
Bhutanese
Immigrants from Asia
5.0%
UNEMPLOYMENT AMONG AGES 65 TO 74 YEARS
100.0/ 100
METRIC RATING
35th/ 347
METRIC RANK
5.3%
UNEMPLOYMENT AMONG AGES 65 TO 74 YEARS
78.4/ 100
METRIC RATING
141st/ 347
METRIC RANK
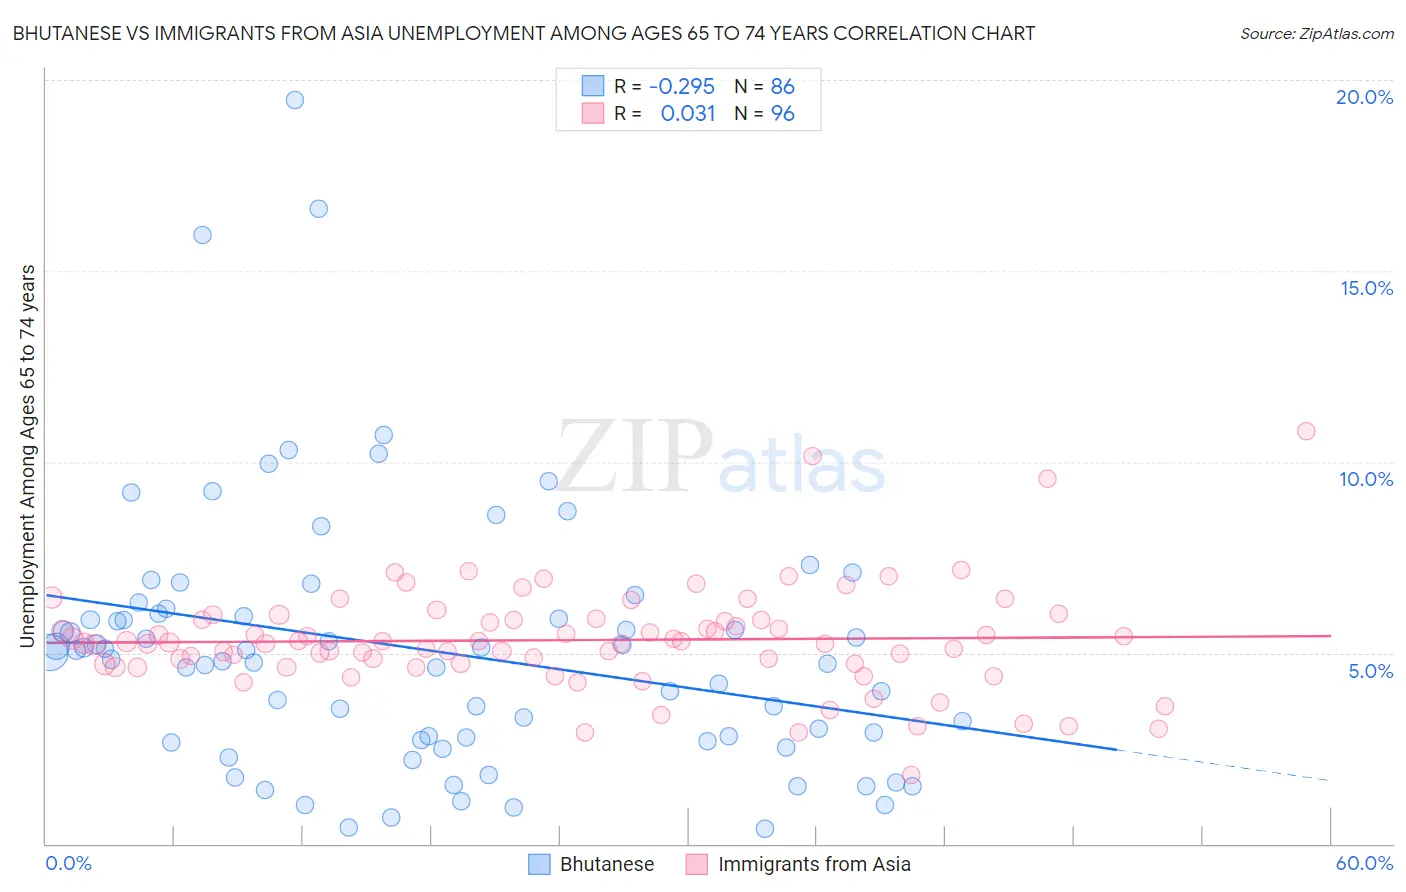
Bhutanese vs Immigrants from Asia Unemployment Among Ages 65 to 74 years Correlation Chart
The statistical analysis conducted on geographies consisting of 389,900,258 people shows a weak negative correlation between the proportion of Bhutanese and unemployment rate among population between the ages 65 and 74 in the United States with a correlation coefficient (R) of -0.295 and weighted average of 5.0%. Similarly, the statistical analysis conducted on geographies consisting of 441,194,838 people shows no correlation between the proportion of Immigrants from Asia and unemployment rate among population between the ages 65 and 74 in the United States with a correlation coefficient (R) of 0.031 and weighted average of 5.3%, a difference of 5.7%.
Unemployment Among Ages 65 to 74 years Correlation Summary
| Measurement | Bhutanese | Immigrants from Asia |
| Minimum | 0.40% | 1.8% |
| Maximum | 19.5% | 10.8% |
| Range | 19.1% | 9.0% |
| Mean | 5.1% | 5.3% |
| Median | 4.9% | 5.3% |
| Interquartile 25% (IQ1) | 2.7% | 4.7% |
| Interquartile 75% (IQ3) | 6.0% | 5.9% |
| Interquartile Range (IQR) | 3.3% | 1.2% |
| Standard Deviation (Sample) | 3.4% | 1.4% |
| Standard Deviation (Population) | 3.4% | 1.4% |
Similar Demographics by Unemployment Among Ages 65 to 74 years
Demographics Similar to Bhutanese by Unemployment Among Ages 65 to 74 years
In terms of unemployment among ages 65 to 74 years, the demographic groups most similar to Bhutanese are Belgian (5.0%, a difference of 0.11%), Cambodian (5.0%, a difference of 0.11%), Palestinian (5.0%, a difference of 0.17%), Immigrants from Kuwait (5.0%, a difference of 0.19%), and Immigrants from Eastern Africa (5.0%, a difference of 0.20%).
| Demographics | Rating | Rank | Unemployment Among Ages 65 to 74 years |
| Bulgarians | 100.0 /100 | #28 | Exceptional 5.0% |
| Ethiopians | 100.0 /100 | #29 | Exceptional 5.0% |
| Immigrants | Lebanon | 100.0 /100 | #30 | Exceptional 5.0% |
| Slovenes | 100.0 /100 | #31 | Exceptional 5.0% |
| Palestinians | 100.0 /100 | #32 | Exceptional 5.0% |
| Belgians | 100.0 /100 | #33 | Exceptional 5.0% |
| Cambodians | 100.0 /100 | #34 | Exceptional 5.0% |
| Bhutanese | 100.0 /100 | #35 | Exceptional 5.0% |
| Immigrants | Kuwait | 99.9 /100 | #36 | Exceptional 5.0% |
| Immigrants | Eastern Africa | 99.9 /100 | #37 | Exceptional 5.0% |
| Nepalese | 99.9 /100 | #38 | Exceptional 5.0% |
| Immigrants | Sweden | 99.9 /100 | #39 | Exceptional 5.0% |
| Immigrants | Iraq | 99.9 /100 | #40 | Exceptional 5.1% |
| Ugandans | 99.9 /100 | #41 | Exceptional 5.1% |
| Jordanians | 99.9 /100 | #42 | Exceptional 5.1% |
Demographics Similar to Immigrants from Asia by Unemployment Among Ages 65 to 74 years
In terms of unemployment among ages 65 to 74 years, the demographic groups most similar to Immigrants from Asia are Immigrants from Laos (5.3%, a difference of 0.010%), Finnish (5.3%, a difference of 0.030%), Chilean (5.3%, a difference of 0.070%), Turkish (5.3%, a difference of 0.11%), and New Zealander (5.3%, a difference of 0.11%).
| Demographics | Rating | Rank | Unemployment Among Ages 65 to 74 years |
| Immigrants | Panama | 81.8 /100 | #134 | Excellent 5.3% |
| Immigrants | Serbia | 81.8 /100 | #135 | Excellent 5.3% |
| Celtics | 80.8 /100 | #136 | Excellent 5.3% |
| Immigrants | Afghanistan | 80.8 /100 | #137 | Excellent 5.3% |
| Chileans | 79.7 /100 | #138 | Good 5.3% |
| Finns | 79.0 /100 | #139 | Good 5.3% |
| Immigrants | Laos | 78.6 /100 | #140 | Good 5.3% |
| Immigrants | Asia | 78.4 /100 | #141 | Good 5.3% |
| Turks | 76.2 /100 | #142 | Good 5.3% |
| New Zealanders | 76.1 /100 | #143 | Good 5.3% |
| Immigrants | Chile | 76.0 /100 | #144 | Good 5.3% |
| Canadians | 75.0 /100 | #145 | Good 5.3% |
| Irish | 74.8 /100 | #146 | Good 5.3% |
| Immigrants | Latvia | 74.6 /100 | #147 | Good 5.3% |
| Immigrants | Sri Lanka | 73.8 /100 | #148 | Good 5.3% |