Bermudan vs Malaysian Unemployment Among Seniors over 65 years
COMPARE
Bermudan
Malaysian
Unemployment Among Seniors over 65 years
Unemployment Among Seniors over 65 years Comparison
Bermudans
Malaysians
5.9%
UNEMPLOYMENT AMONG SENIORS OVER 65 YEARS
0.0/ 100
METRIC RATING
327th/ 347
METRIC RANK
5.1%
UNEMPLOYMENT AMONG SENIORS OVER 65 YEARS
90.4/ 100
METRIC RATING
117th/ 347
METRIC RANK
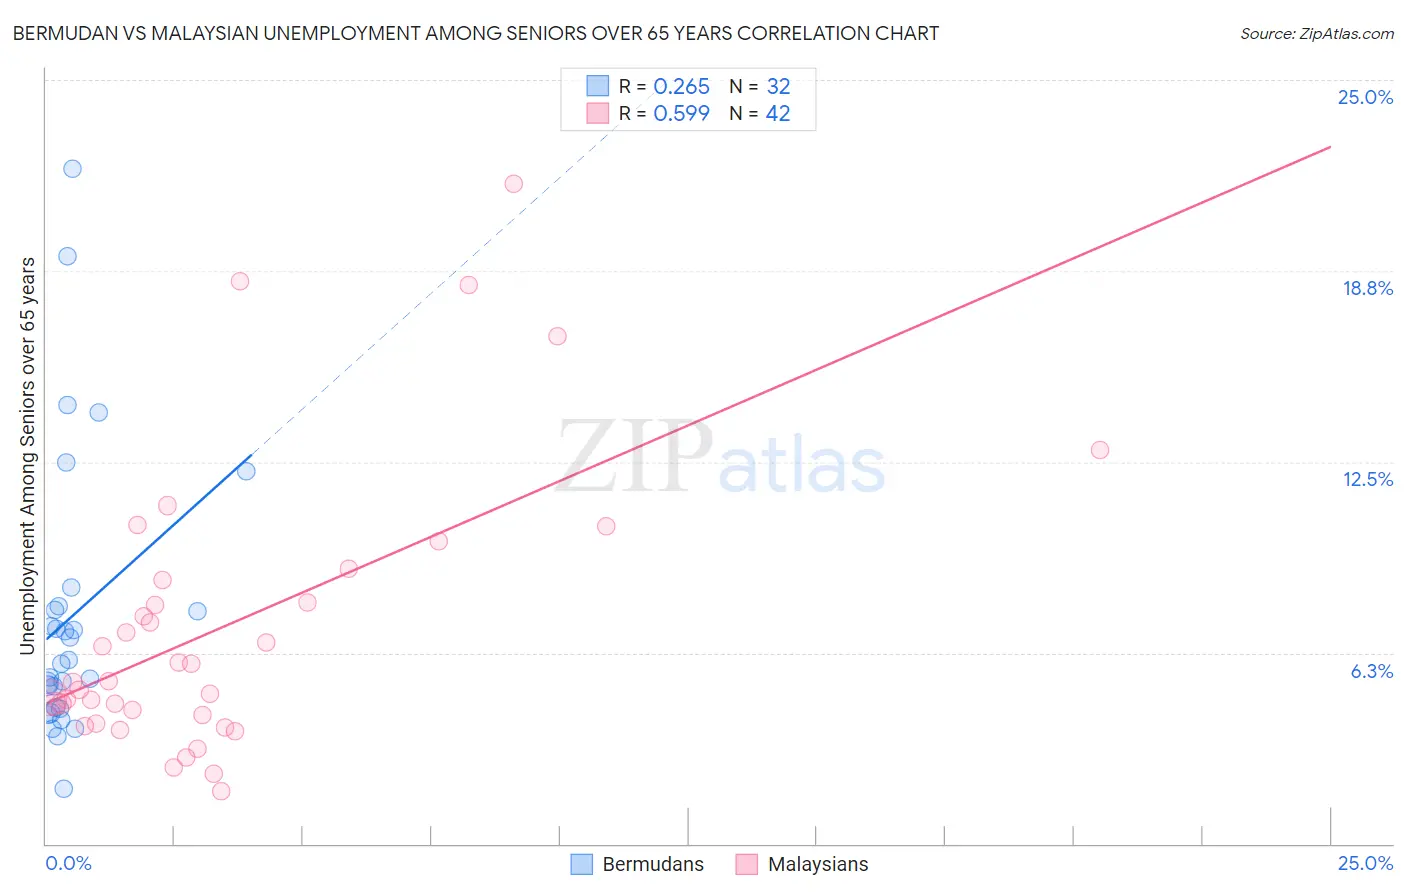
Bermudan vs Malaysian Unemployment Among Seniors over 65 years Correlation Chart
The statistical analysis conducted on geographies consisting of 54,539,220 people shows a weak positive correlation between the proportion of Bermudans and unemployment rate amomg seniors over the age of 65 in the United States with a correlation coefficient (R) of 0.265 and weighted average of 5.9%. Similarly, the statistical analysis conducted on geographies consisting of 210,872,755 people shows a substantial positive correlation between the proportion of Malaysians and unemployment rate amomg seniors over the age of 65 in the United States with a correlation coefficient (R) of 0.599 and weighted average of 5.1%, a difference of 16.5%.
Unemployment Among Seniors over 65 years Correlation Summary
| Measurement | Bermudan | Malaysian |
| Minimum | 1.8% | 1.7% |
| Maximum | 22.1% | 21.6% |
| Range | 20.3% | 19.9% |
| Mean | 7.5% | 7.1% |
| Median | 5.9% | 5.3% |
| Interquartile 25% (IQ1) | 4.4% | 4.2% |
| Interquartile 75% (IQ3) | 7.7% | 8.6% |
| Interquartile Range (IQR) | 3.3% | 4.4% |
| Standard Deviation (Sample) | 4.6% | 4.6% |
| Standard Deviation (Population) | 4.5% | 4.6% |
Similar Demographics by Unemployment Among Seniors over 65 years
Demographics Similar to Bermudans by Unemployment Among Seniors over 65 years
In terms of unemployment among seniors over 65 years, the demographic groups most similar to Bermudans are Shoshone (5.9%, a difference of 0.48%), Puerto Rican (5.9%, a difference of 0.53%), Inupiat (5.8%, a difference of 0.91%), Dominican (6.0%, a difference of 1.3%), and Immigrants from Portugal (6.0%, a difference of 1.3%).
| Demographics | Rating | Rank | Unemployment Among Seniors over 65 years |
| Immigrants | Mexico | 0.0 /100 | #320 | Tragic 5.7% |
| British West Indians | 0.0 /100 | #321 | Tragic 5.8% |
| Natives/Alaskans | 0.0 /100 | #322 | Tragic 5.8% |
| Immigrants | Dominica | 0.0 /100 | #323 | Tragic 5.8% |
| Yuman | 0.0 /100 | #324 | Tragic 5.8% |
| Inupiat | 0.0 /100 | #325 | Tragic 5.8% |
| Shoshone | 0.0 /100 | #326 | Tragic 5.9% |
| Bermudans | 0.0 /100 | #327 | Tragic 5.9% |
| Puerto Ricans | 0.0 /100 | #328 | Tragic 5.9% |
| Dominicans | 0.0 /100 | #329 | Tragic 6.0% |
| Immigrants | Portugal | 0.0 /100 | #330 | Tragic 6.0% |
| Taiwanese | 0.0 /100 | #331 | Tragic 6.0% |
| Aleuts | 0.0 /100 | #332 | Tragic 6.0% |
| Immigrants | Dominican Republic | 0.0 /100 | #333 | Tragic 6.0% |
| Tohono O'odham | 0.0 /100 | #334 | Tragic 6.1% |
Demographics Similar to Malaysians by Unemployment Among Seniors over 65 years
In terms of unemployment among seniors over 65 years, the demographic groups most similar to Malaysians are Soviet Union (5.1%, a difference of 0.030%), Immigrants from Korea (5.0%, a difference of 0.060%), Immigrants from Canada (5.1%, a difference of 0.070%), Immigrants from Latvia (5.0%, a difference of 0.090%), and Celtic (5.0%, a difference of 0.090%).
| Demographics | Rating | Rank | Unemployment Among Seniors over 65 years |
| Immigrants | Saudi Arabia | 92.7 /100 | #110 | Exceptional 5.0% |
| Finns | 92.2 /100 | #111 | Exceptional 5.0% |
| Eastern Europeans | 92.0 /100 | #112 | Exceptional 5.0% |
| Seminole | 91.4 /100 | #113 | Exceptional 5.0% |
| Immigrants | Latvia | 91.4 /100 | #114 | Exceptional 5.0% |
| Celtics | 91.3 /100 | #115 | Exceptional 5.0% |
| Immigrants | Korea | 91.0 /100 | #116 | Exceptional 5.0% |
| Malaysians | 90.4 /100 | #117 | Exceptional 5.1% |
| Soviet Union | 90.1 /100 | #118 | Exceptional 5.1% |
| Immigrants | Canada | 89.7 /100 | #119 | Excellent 5.1% |
| Irish | 88.8 /100 | #120 | Excellent 5.1% |
| Puget Sound Salish | 88.7 /100 | #121 | Excellent 5.1% |
| Immigrants | Cameroon | 88.6 /100 | #122 | Excellent 5.1% |
| Asians | 88.5 /100 | #123 | Excellent 5.1% |
| Immigrants | North America | 87.9 /100 | #124 | Excellent 5.1% |