Bermudan vs Guatemalan Unemployment Among Ages 35 to 44 years
COMPARE
Bermudan
Guatemalan
Unemployment Among Ages 35 to 44 years
Unemployment Among Ages 35 to 44 years Comparison
Bermudans
Guatemalans
5.0%
UNEMPLOYMENT AMONG AGES 35 TO 44 YEARS
3.9/ 100
METRIC RATING
221st/ 347
METRIC RANK
5.1%
UNEMPLOYMENT AMONG AGES 35 TO 44 YEARS
0.4/ 100
METRIC RATING
244th/ 347
METRIC RANK
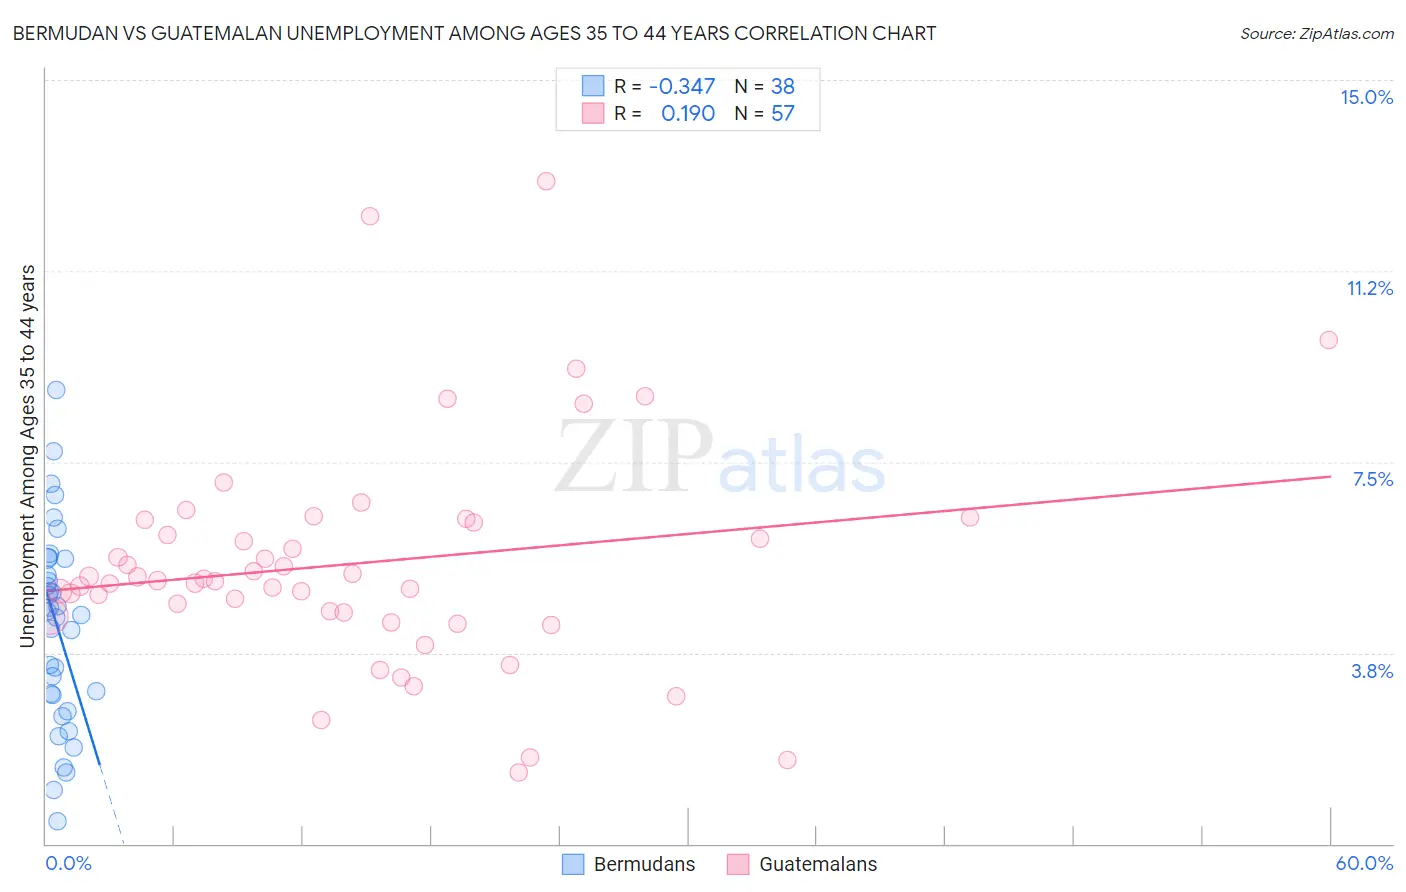
Bermudan vs Guatemalan Unemployment Among Ages 35 to 44 years Correlation Chart
The statistical analysis conducted on geographies consisting of 55,599,053 people shows a mild negative correlation between the proportion of Bermudans and unemployment rate among population between the ages 35 and 44 in the United States with a correlation coefficient (R) of -0.347 and weighted average of 5.0%. Similarly, the statistical analysis conducted on geographies consisting of 400,910,127 people shows a poor positive correlation between the proportion of Guatemalans and unemployment rate among population between the ages 35 and 44 in the United States with a correlation coefficient (R) of 0.190 and weighted average of 5.1%, a difference of 3.7%.
Unemployment Among Ages 35 to 44 years Correlation Summary
| Measurement | Bermudan | Guatemalan |
| Minimum | 0.44% | 1.4% |
| Maximum | 8.9% | 13.0% |
| Range | 8.5% | 11.6% |
| Mean | 4.3% | 5.5% |
| Median | 4.5% | 5.2% |
| Interquartile 25% (IQ1) | 2.9% | 4.5% |
| Interquartile 75% (IQ3) | 5.6% | 6.3% |
| Interquartile Range (IQR) | 2.7% | 1.8% |
| Standard Deviation (Sample) | 1.9% | 2.2% |
| Standard Deviation (Population) | 1.9% | 2.2% |
Similar Demographics by Unemployment Among Ages 35 to 44 years
Demographics Similar to Bermudans by Unemployment Among Ages 35 to 44 years
In terms of unemployment among ages 35 to 44 years, the demographic groups most similar to Bermudans are Hmong (5.0%, a difference of 0.19%), Immigrants from Panama (5.0%, a difference of 0.27%), Immigrants from Sierra Leone (4.9%, a difference of 0.32%), Sierra Leonean (4.9%, a difference of 0.35%), and Panamanian (5.0%, a difference of 0.50%).
| Demographics | Rating | Rank | Unemployment Among Ages 35 to 44 years |
| Immigrants | Africa | 8.2 /100 | #214 | Tragic 4.9% |
| Immigrants | Immigrants | 8.0 /100 | #215 | Tragic 4.9% |
| Americans | 6.2 /100 | #216 | Tragic 4.9% |
| Moroccans | 6.0 /100 | #217 | Tragic 4.9% |
| Chickasaw | 5.7 /100 | #218 | Tragic 4.9% |
| Sierra Leoneans | 4.8 /100 | #219 | Tragic 4.9% |
| Immigrants | Sierra Leone | 4.7 /100 | #220 | Tragic 4.9% |
| Bermudans | 3.9 /100 | #221 | Tragic 5.0% |
| Hmong | 3.5 /100 | #222 | Tragic 5.0% |
| Immigrants | Panama | 3.3 /100 | #223 | Tragic 5.0% |
| Panamanians | 2.9 /100 | #224 | Tragic 5.0% |
| Immigrants | Lebanon | 2.7 /100 | #225 | Tragic 5.0% |
| Potawatomi | 2.5 /100 | #226 | Tragic 5.0% |
| Immigrants | Uzbekistan | 1.9 /100 | #227 | Tragic 5.0% |
| Samoans | 1.8 /100 | #228 | Tragic 5.0% |
Demographics Similar to Guatemalans by Unemployment Among Ages 35 to 44 years
In terms of unemployment among ages 35 to 44 years, the demographic groups most similar to Guatemalans are Salvadoran (5.1%, a difference of 0.0%), Delaware (5.1%, a difference of 0.13%), Bahamian (5.2%, a difference of 0.25%), Immigrants from Guatemala (5.2%, a difference of 0.26%), and Immigrants from Somalia (5.2%, a difference of 0.42%).
| Demographics | Rating | Rank | Unemployment Among Ages 35 to 44 years |
| Kiowa | 0.8 /100 | #237 | Tragic 5.1% |
| Hondurans | 0.7 /100 | #238 | Tragic 5.1% |
| Nigerians | 0.7 /100 | #239 | Tragic 5.1% |
| Somalis | 0.7 /100 | #240 | Tragic 5.1% |
| Immigrants | Honduras | 0.6 /100 | #241 | Tragic 5.1% |
| Delaware | 0.5 /100 | #242 | Tragic 5.1% |
| Salvadorans | 0.4 /100 | #243 | Tragic 5.1% |
| Guatemalans | 0.4 /100 | #244 | Tragic 5.1% |
| Bahamians | 0.4 /100 | #245 | Tragic 5.2% |
| Immigrants | Guatemala | 0.4 /100 | #246 | Tragic 5.2% |
| Immigrants | Somalia | 0.3 /100 | #247 | Tragic 5.2% |
| Alsatians | 0.2 /100 | #248 | Tragic 5.2% |
| Immigrants | Liberia | 0.2 /100 | #249 | Tragic 5.2% |
| Immigrants | El Salvador | 0.2 /100 | #250 | Tragic 5.2% |
| Comanche | 0.2 /100 | #251 | Tragic 5.2% |