Belizean vs British West Indian Unemployment Among Youth under 25 years
COMPARE
Belizean
British West Indian
Unemployment Among Youth under 25 years
Unemployment Among Youth under 25 years Comparison
Belizeans
British West Indians
13.8%
UNEMPLOYMENT AMONG YOUTH UNDER 25 YEARS
0.0/ 100
METRIC RATING
303rd/ 347
METRIC RANK
15.5%
UNEMPLOYMENT AMONG YOUTH UNDER 25 YEARS
0.0/ 100
METRIC RATING
327th/ 347
METRIC RANK
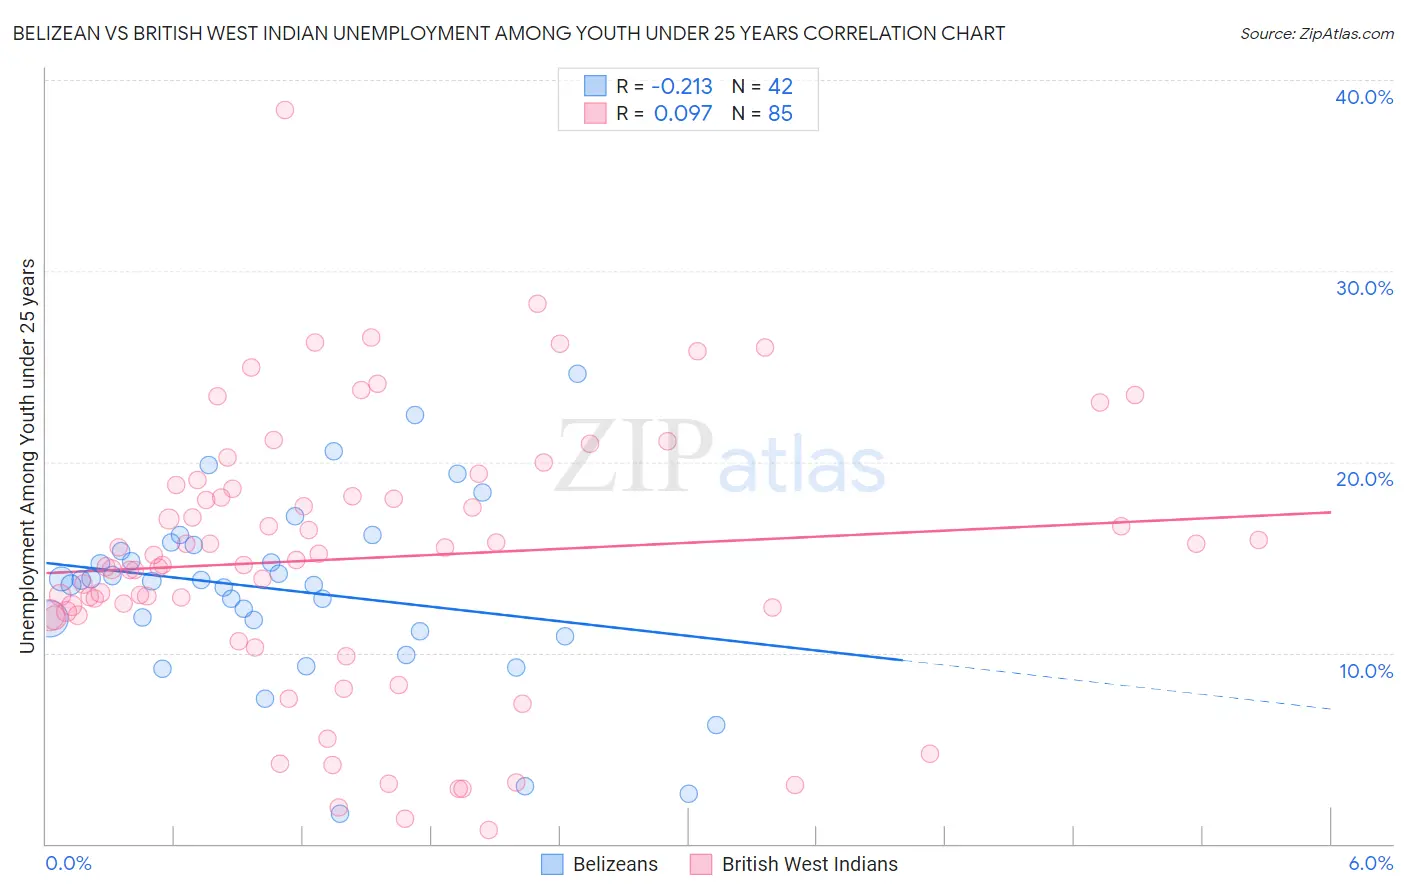
Belizean vs British West Indian Unemployment Among Youth under 25 years Correlation Chart
The statistical analysis conducted on geographies consisting of 143,823,570 people shows a weak negative correlation between the proportion of Belizeans and unemployment rate among youth under the age of 25 in the United States with a correlation coefficient (R) of -0.213 and weighted average of 13.8%. Similarly, the statistical analysis conducted on geographies consisting of 152,199,351 people shows a slight positive correlation between the proportion of British West Indians and unemployment rate among youth under the age of 25 in the United States with a correlation coefficient (R) of 0.097 and weighted average of 15.5%, a difference of 12.4%.
Unemployment Among Youth under 25 years Correlation Summary
| Measurement | Belizean | British West Indian |
| Minimum | 1.6% | 0.70% |
| Maximum | 24.6% | 38.4% |
| Range | 23.0% | 37.7% |
| Mean | 13.3% | 14.9% |
| Median | 13.8% | 14.9% |
| Interquartile 25% (IQ1) | 11.2% | 12.0% |
| Interquartile 75% (IQ3) | 15.7% | 18.7% |
| Interquartile Range (IQR) | 4.5% | 6.7% |
| Standard Deviation (Sample) | 4.8% | 7.1% |
| Standard Deviation (Population) | 4.8% | 7.0% |
Similar Demographics by Unemployment Among Youth under 25 years
Demographics Similar to Belizeans by Unemployment Among Youth under 25 years
In terms of unemployment among youth under 25 years, the demographic groups most similar to Belizeans are Houma (13.8%, a difference of 0.010%), Immigrants from Sierra Leone (13.8%, a difference of 0.040%), Immigrants from Senegal (13.8%, a difference of 0.080%), Immigrants from Cabo Verde (13.8%, a difference of 0.25%), and Haitian (13.9%, a difference of 0.33%).
| Demographics | Rating | Rank | Unemployment Among Youth under 25 years |
| Senegalese | 0.0 /100 | #296 | Tragic 13.5% |
| U.S. Virgin Islanders | 0.0 /100 | #297 | Tragic 13.6% |
| Shoshone | 0.0 /100 | #298 | Tragic 13.7% |
| Tohono O'odham | 0.0 /100 | #299 | Tragic 13.8% |
| Immigrants | Cabo Verde | 0.0 /100 | #300 | Tragic 13.8% |
| Immigrants | Senegal | 0.0 /100 | #301 | Tragic 13.8% |
| Immigrants | Sierra Leone | 0.0 /100 | #302 | Tragic 13.8% |
| Belizeans | 0.0 /100 | #303 | Tragic 13.8% |
| Houma | 0.0 /100 | #304 | Tragic 13.8% |
| Haitians | 0.0 /100 | #305 | Tragic 13.9% |
| Pueblo | 0.0 /100 | #306 | Tragic 13.9% |
| Immigrants | Haiti | 0.0 /100 | #307 | Tragic 14.0% |
| Immigrants | Belize | 0.0 /100 | #308 | Tragic 14.0% |
| Aleuts | 0.0 /100 | #309 | Tragic 14.1% |
| Immigrants | West Indies | 0.0 /100 | #310 | Tragic 14.2% |
Demographics Similar to British West Indians by Unemployment Among Youth under 25 years
In terms of unemployment among youth under 25 years, the demographic groups most similar to British West Indians are Immigrants from Dominican Republic (15.6%, a difference of 0.11%), Immigrants from Yemen (15.6%, a difference of 0.24%), Yakama (15.6%, a difference of 0.28%), Dominican (15.7%, a difference of 1.1%), and Immigrants from Grenada (15.8%, a difference of 1.8%).
| Demographics | Rating | Rank | Unemployment Among Youth under 25 years |
| Barbadians | 0.0 /100 | #320 | Tragic 14.6% |
| Cheyenne | 0.0 /100 | #321 | Tragic 14.6% |
| Trinidadians and Tobagonians | 0.0 /100 | #322 | Tragic 14.6% |
| Immigrants | Trinidad and Tobago | 0.0 /100 | #323 | Tragic 14.6% |
| Immigrants | Jamaica | 0.0 /100 | #324 | Tragic 14.8% |
| Alaska Natives | 0.0 /100 | #325 | Tragic 14.9% |
| Immigrants | Barbados | 0.0 /100 | #326 | Tragic 15.2% |
| British West Indians | 0.0 /100 | #327 | Tragic 15.5% |
| Immigrants | Dominican Republic | 0.0 /100 | #328 | Tragic 15.6% |
| Immigrants | Yemen | 0.0 /100 | #329 | Tragic 15.6% |
| Yakama | 0.0 /100 | #330 | Tragic 15.6% |
| Dominicans | 0.0 /100 | #331 | Tragic 15.7% |
| Immigrants | Grenada | 0.0 /100 | #332 | Tragic 15.8% |
| Guyanese | 0.0 /100 | #333 | Tragic 15.9% |
| Immigrants | Guyana | 0.0 /100 | #334 | Tragic 15.9% |