Belgian vs Mexican Unemployment Among Youth under 25 years
COMPARE
Belgian
Mexican
Unemployment Among Youth under 25 years
Unemployment Among Youth under 25 years Comparison
Belgians
Mexicans
10.6%
UNEMPLOYMENT AMONG YOUTH UNDER 25 YEARS
100.0/ 100
METRIC RATING
22nd/ 347
METRIC RANK
12.3%
UNEMPLOYMENT AMONG YOUTH UNDER 25 YEARS
0.3/ 100
METRIC RATING
253rd/ 347
METRIC RANK
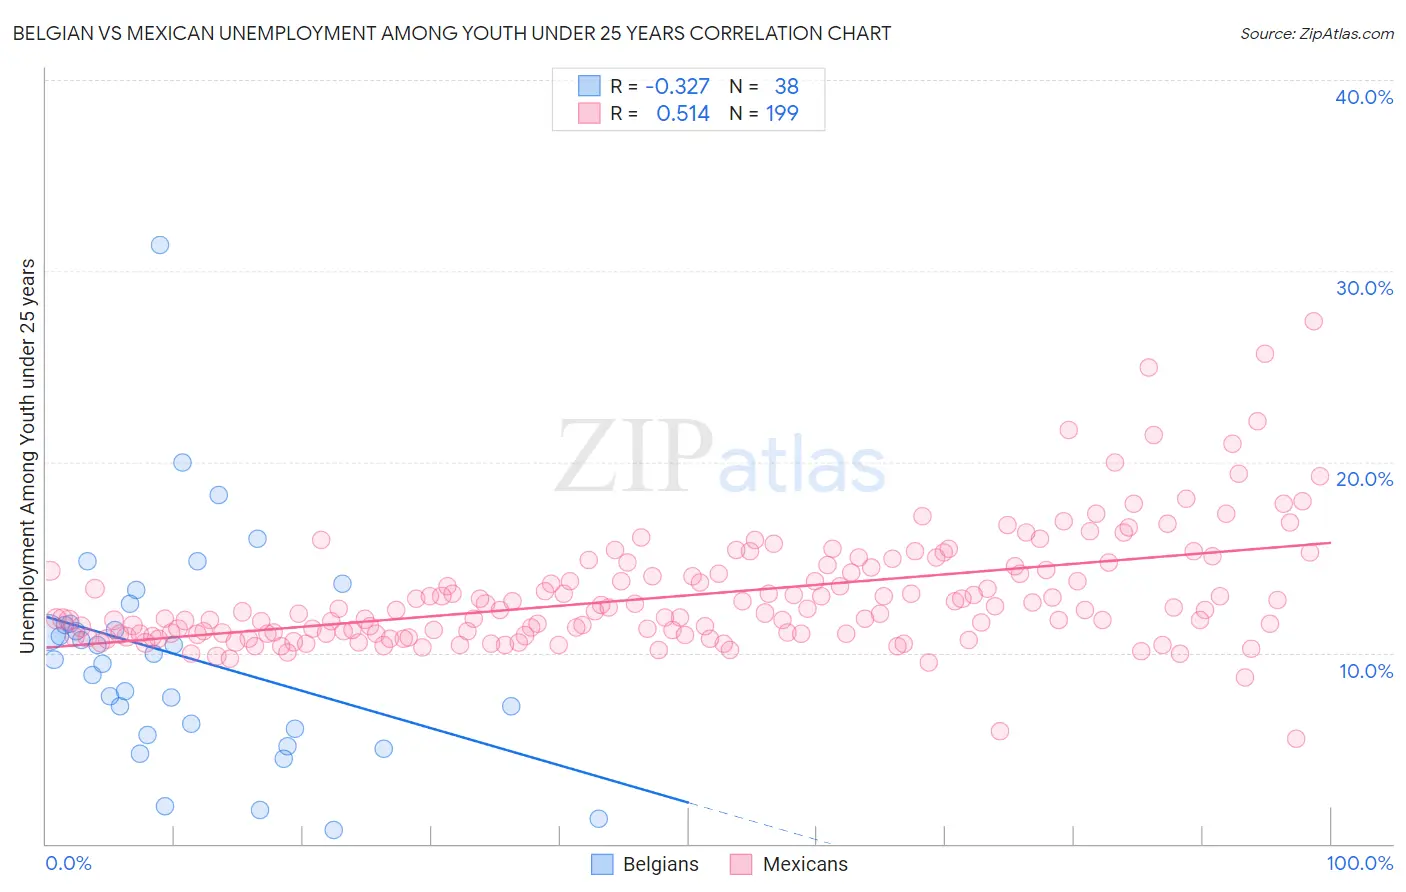
Belgian vs Mexican Unemployment Among Youth under 25 years Correlation Chart
The statistical analysis conducted on geographies consisting of 350,624,639 people shows a mild negative correlation between the proportion of Belgians and unemployment rate among youth under the age of 25 in the United States with a correlation coefficient (R) of -0.327 and weighted average of 10.6%. Similarly, the statistical analysis conducted on geographies consisting of 543,925,424 people shows a substantial positive correlation between the proportion of Mexicans and unemployment rate among youth under the age of 25 in the United States with a correlation coefficient (R) of 0.514 and weighted average of 12.3%, a difference of 15.7%.
Unemployment Among Youth under 25 years Correlation Summary
| Measurement | Belgian | Mexican |
| Minimum | 0.70% | 5.5% |
| Maximum | 31.3% | 27.3% |
| Range | 30.6% | 21.8% |
| Mean | 9.8% | 13.0% |
| Median | 9.8% | 12.2% |
| Interquartile 25% (IQ1) | 6.0% | 11.0% |
| Interquartile 75% (IQ3) | 11.5% | 14.4% |
| Interquartile Range (IQR) | 5.5% | 3.4% |
| Standard Deviation (Sample) | 5.8% | 3.1% |
| Standard Deviation (Population) | 5.7% | 3.1% |
Similar Demographics by Unemployment Among Youth under 25 years
Demographics Similar to Belgians by Unemployment Among Youth under 25 years
In terms of unemployment among youth under 25 years, the demographic groups most similar to Belgians are Pennsylvania German (10.6%, a difference of 0.010%), Immigrants from Bosnia and Herzegovina (10.6%, a difference of 0.060%), Dutch (10.6%, a difference of 0.22%), Immigrants from Burma/Myanmar (10.6%, a difference of 0.25%), and Swiss (10.6%, a difference of 0.26%).
| Demographics | Rating | Rank | Unemployment Among Youth under 25 years |
| Sudanese | 100.0 /100 | #15 | Exceptional 10.6% |
| Venezuelans | 100.0 /100 | #16 | Exceptional 10.6% |
| Menominee | 100.0 /100 | #17 | Exceptional 10.6% |
| Swiss | 100.0 /100 | #18 | Exceptional 10.6% |
| Immigrants | Burma/Myanmar | 100.0 /100 | #19 | Exceptional 10.6% |
| Dutch | 100.0 /100 | #20 | Exceptional 10.6% |
| Pennsylvania Germans | 100.0 /100 | #21 | Exceptional 10.6% |
| Belgians | 100.0 /100 | #22 | Exceptional 10.6% |
| Immigrants | Bosnia and Herzegovina | 100.0 /100 | #23 | Exceptional 10.6% |
| Finns | 100.0 /100 | #24 | Exceptional 10.7% |
| Immigrants | North Macedonia | 100.0 /100 | #25 | Exceptional 10.7% |
| Immigrants | India | 100.0 /100 | #26 | Exceptional 10.7% |
| Yugoslavians | 100.0 /100 | #27 | Exceptional 10.7% |
| Somalis | 100.0 /100 | #28 | Exceptional 10.7% |
| Chinese | 99.9 /100 | #29 | Exceptional 10.7% |
Demographics Similar to Mexicans by Unemployment Among Youth under 25 years
In terms of unemployment among youth under 25 years, the demographic groups most similar to Mexicans are Honduran (12.3%, a difference of 0.020%), Immigrants from Syria (12.3%, a difference of 0.040%), Mexican American Indian (12.3%, a difference of 0.080%), Delaware (12.3%, a difference of 0.11%), and Soviet Union (12.2%, a difference of 0.53%).
| Demographics | Rating | Rank | Unemployment Among Youth under 25 years |
| Immigrants | Honduras | 0.6 /100 | #246 | Tragic 12.2% |
| Immigrants | Greece | 0.6 /100 | #247 | Tragic 12.2% |
| Central Americans | 0.6 /100 | #248 | Tragic 12.2% |
| Soviet Union | 0.6 /100 | #249 | Tragic 12.2% |
| Delaware | 0.4 /100 | #250 | Tragic 12.3% |
| Mexican American Indians | 0.4 /100 | #251 | Tragic 12.3% |
| Immigrants | Syria | 0.3 /100 | #252 | Tragic 12.3% |
| Mexicans | 0.3 /100 | #253 | Tragic 12.3% |
| Hondurans | 0.3 /100 | #254 | Tragic 12.3% |
| Hispanics or Latinos | 0.2 /100 | #255 | Tragic 12.4% |
| Liberians | 0.2 /100 | #256 | Tragic 12.4% |
| Panamanians | 0.2 /100 | #257 | Tragic 12.4% |
| Salvadorans | 0.1 /100 | #258 | Tragic 12.4% |
| Immigrants | Central America | 0.1 /100 | #259 | Tragic 12.4% |
| Immigrants | Panama | 0.1 /100 | #260 | Tragic 12.4% |