Belgian vs Lumbee Unemployment Among Seniors over 65 years
COMPARE
Belgian
Lumbee
Unemployment Among Seniors over 65 years
Unemployment Among Seniors over 65 years Comparison
Belgians
Lumbee
4.8%
UNEMPLOYMENT AMONG SENIORS OVER 65 YEARS
100.0/ 100
METRIC RATING
30th/ 347
METRIC RANK
4.6%
UNEMPLOYMENT AMONG SENIORS OVER 65 YEARS
100.0/ 100
METRIC RATING
15th/ 347
METRIC RANK
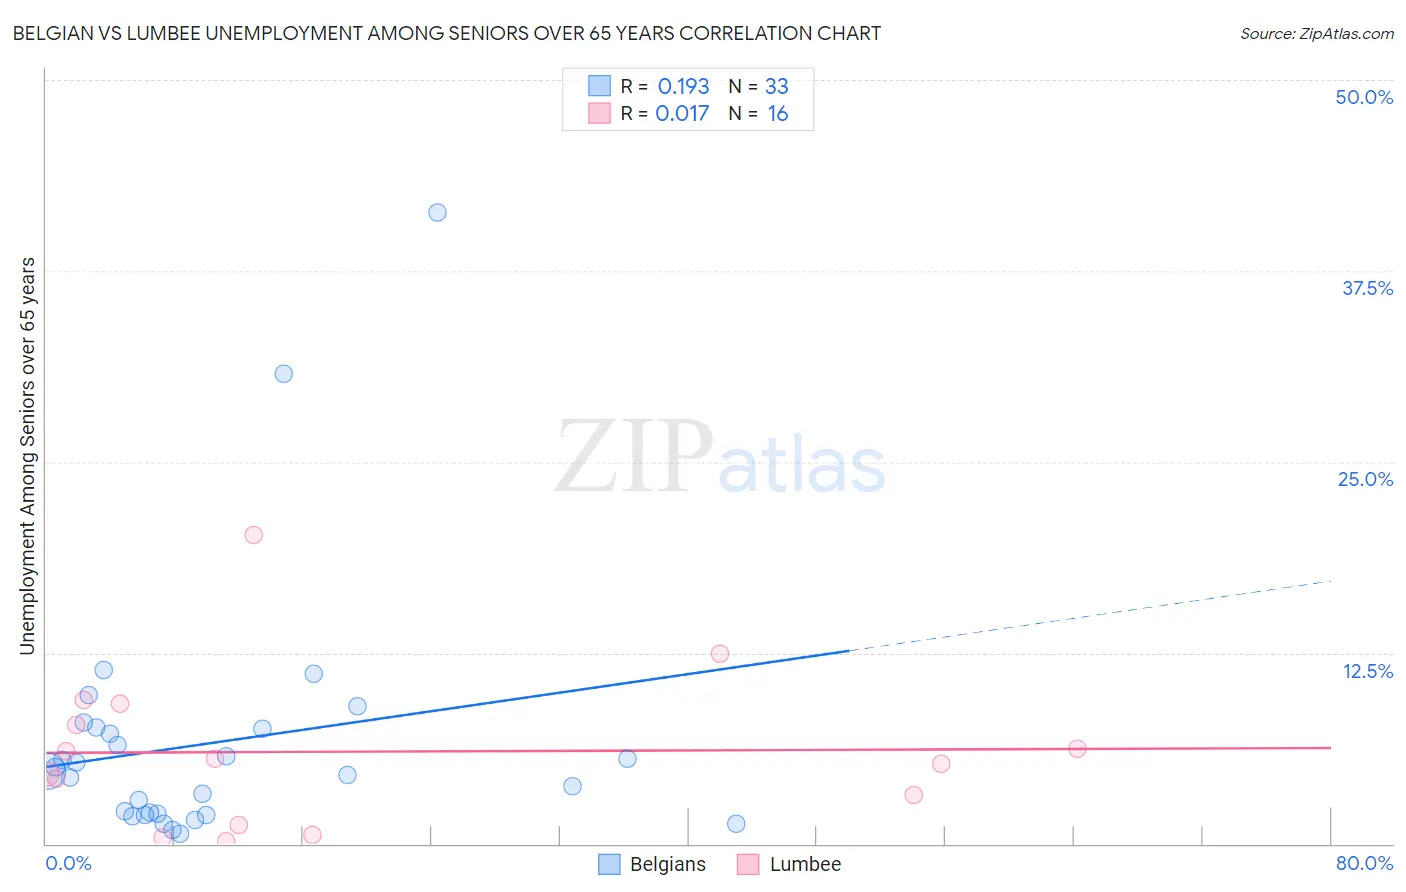
Belgian vs Lumbee Unemployment Among Seniors over 65 years Correlation Chart
The statistical analysis conducted on geographies consisting of 318,110,526 people shows a poor positive correlation between the proportion of Belgians and unemployment rate amomg seniors over the age of 65 in the United States with a correlation coefficient (R) of 0.193 and weighted average of 4.8%. Similarly, the statistical analysis conducted on geographies consisting of 86,768,453 people shows no correlation between the proportion of Lumbee and unemployment rate amomg seniors over the age of 65 in the United States with a correlation coefficient (R) of 0.017 and weighted average of 4.6%, a difference of 3.5%.
Unemployment Among Seniors over 65 years Correlation Summary
| Measurement | Belgian | Lumbee |
| Minimum | 0.68% | 0.20% |
| Maximum | 41.3% | 20.2% |
| Range | 40.6% | 20.0% |
| Mean | 6.6% | 6.0% |
| Median | 4.7% | 5.4% |
| Interquartile 25% (IQ1) | 1.9% | 2.2% |
| Interquartile 75% (IQ3) | 7.6% | 8.5% |
| Interquartile Range (IQR) | 5.6% | 6.3% |
| Standard Deviation (Sample) | 8.3% | 5.2% |
| Standard Deviation (Population) | 8.1% | 5.0% |
Demographics Similar to Belgians and Lumbee by Unemployment Among Seniors over 65 years
In terms of unemployment among seniors over 65 years, the demographic groups most similar to Belgians are Immigrants from Uganda (4.8%, a difference of 0.20%), Slovene (4.8%, a difference of 0.21%), Immigrants from North Macedonia (4.8%, a difference of 0.40%), Ugandan (4.8%, a difference of 0.49%), and Houma (4.8%, a difference of 0.57%). Similarly, the demographic groups most similar to Lumbee are Immigrants from Burma/Myanmar (4.6%, a difference of 0.010%), Menominee (4.6%, a difference of 0.080%), Creek (4.6%, a difference of 0.11%), Immigrants from Eritrea (4.7%, a difference of 0.41%), and Cuban (4.6%, a difference of 0.52%).
| Demographics | Rating | Rank | Unemployment Among Seniors over 65 years |
| Osage | 100.0 /100 | #12 | Exceptional 4.6% |
| Cubans | 100.0 /100 | #13 | Exceptional 4.6% |
| Menominee | 100.0 /100 | #14 | Exceptional 4.6% |
| Lumbee | 100.0 /100 | #15 | Exceptional 4.6% |
| Immigrants | Burma/Myanmar | 100.0 /100 | #16 | Exceptional 4.6% |
| Creek | 100.0 /100 | #17 | Exceptional 4.6% |
| Immigrants | Eritrea | 100.0 /100 | #18 | Exceptional 4.7% |
| Lebanese | 100.0 /100 | #19 | Exceptional 4.7% |
| Immigrants | Nepal | 100.0 /100 | #20 | Exceptional 4.7% |
| Norwegians | 100.0 /100 | #21 | Exceptional 4.7% |
| Czechs | 100.0 /100 | #22 | Exceptional 4.7% |
| Kenyans | 100.0 /100 | #23 | Exceptional 4.7% |
| Iraqis | 100.0 /100 | #24 | Exceptional 4.7% |
| Tongans | 100.0 /100 | #25 | Exceptional 4.7% |
| Immigrants | Lebanon | 100.0 /100 | #26 | Exceptional 4.8% |
| Houma | 100.0 /100 | #27 | Exceptional 4.8% |
| Ugandans | 100.0 /100 | #28 | Exceptional 4.8% |
| Immigrants | North Macedonia | 100.0 /100 | #29 | Exceptional 4.8% |
| Belgians | 100.0 /100 | #30 | Exceptional 4.8% |
| Immigrants | Uganda | 100.0 /100 | #31 | Exceptional 4.8% |
| Slovenes | 100.0 /100 | #32 | Exceptional 4.8% |