Belgian vs Immigrants from Zimbabwe Unemployment Among Seniors over 75 years
COMPARE
Belgian
Immigrants from Zimbabwe
Unemployment Among Seniors over 75 years
Unemployment Among Seniors over 75 years Comparison
Belgians
Immigrants from Zimbabwe
9.9%
UNEMPLOYMENT AMONG SENIORS OVER 75 YEARS
0.0/ 100
METRIC RATING
299th/ 347
METRIC RANK
9.0%
UNEMPLOYMENT AMONG SENIORS OVER 75 YEARS
7.8/ 100
METRIC RATING
220th/ 347
METRIC RANK
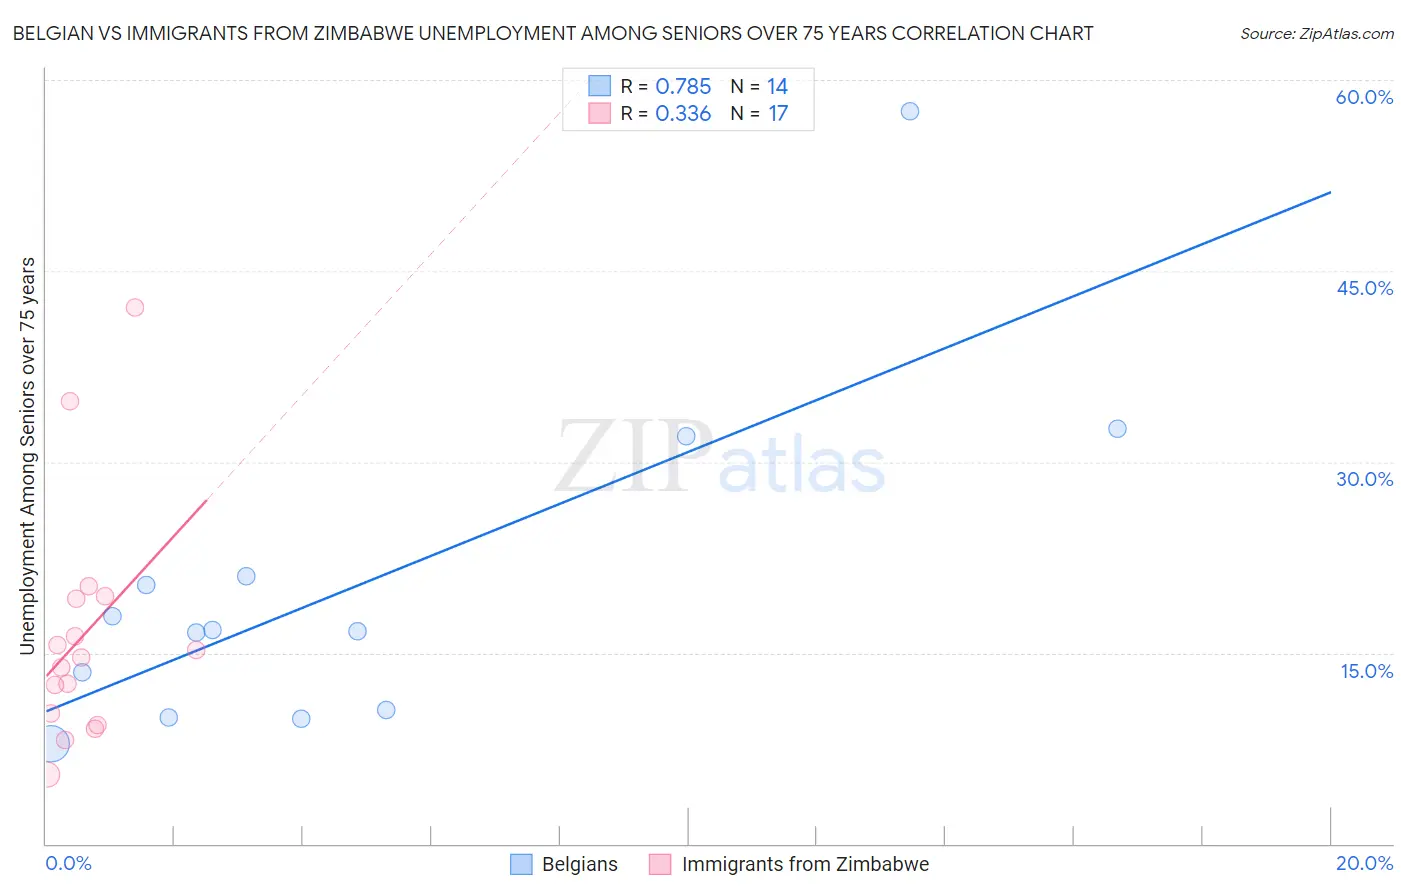
Belgian vs Immigrants from Zimbabwe Unemployment Among Seniors over 75 years Correlation Chart
The statistical analysis conducted on geographies consisting of 184,859,103 people shows a strong positive correlation between the proportion of Belgians and unemployment rate among seniors over the age of 75 in the United States with a correlation coefficient (R) of 0.785 and weighted average of 9.9%. Similarly, the statistical analysis conducted on geographies consisting of 87,278,109 people shows a mild positive correlation between the proportion of Immigrants from Zimbabwe and unemployment rate among seniors over the age of 75 in the United States with a correlation coefficient (R) of 0.336 and weighted average of 9.0%, a difference of 9.7%.
Unemployment Among Seniors over 75 years Correlation Summary
| Measurement | Belgian | Immigrants from Zimbabwe |
| Minimum | 7.8% | 5.4% |
| Maximum | 57.5% | 42.1% |
| Range | 49.7% | 36.7% |
| Mean | 20.2% | 16.4% |
| Median | 16.8% | 14.7% |
| Interquartile 25% (IQ1) | 10.5% | 9.8% |
| Interquartile 75% (IQ3) | 21.0% | 19.3% |
| Interquartile Range (IQR) | 10.5% | 9.6% |
| Standard Deviation (Sample) | 13.1% | 9.4% |
| Standard Deviation (Population) | 12.6% | 9.1% |
Similar Demographics by Unemployment Among Seniors over 75 years
Demographics Similar to Belgians by Unemployment Among Seniors over 75 years
In terms of unemployment among seniors over 75 years, the demographic groups most similar to Belgians are Iraqi (9.9%, a difference of 0.020%), Lithuanian (9.9%, a difference of 0.28%), Welsh (10.0%, a difference of 0.45%), Finnish (10.0%, a difference of 0.55%), and Puget Sound Salish (10.0%, a difference of 0.63%).
| Demographics | Rating | Rank | Unemployment Among Seniors over 75 years |
| Immigrants | Western Africa | 0.0 /100 | #292 | Tragic 9.8% |
| Norwegians | 0.0 /100 | #293 | Tragic 9.8% |
| Immigrants | Dominica | 0.0 /100 | #294 | Tragic 9.8% |
| Immigrants | Nonimmigrants | 0.0 /100 | #295 | Tragic 9.8% |
| Immigrants | St. Vincent and the Grenadines | 0.0 /100 | #296 | Tragic 9.8% |
| Cherokee | 0.0 /100 | #297 | Tragic 9.8% |
| Lithuanians | 0.0 /100 | #298 | Tragic 9.9% |
| Belgians | 0.0 /100 | #299 | Tragic 9.9% |
| Iraqis | 0.0 /100 | #300 | Tragic 9.9% |
| Welsh | 0.0 /100 | #301 | Tragic 10.0% |
| Finns | 0.0 /100 | #302 | Tragic 10.0% |
| Puget Sound Salish | 0.0 /100 | #303 | Tragic 10.0% |
| Scotch-Irish | 0.0 /100 | #304 | Tragic 10.0% |
| Swedes | 0.0 /100 | #305 | Tragic 10.0% |
| Italians | 0.0 /100 | #306 | Tragic 10.0% |
Demographics Similar to Immigrants from Zimbabwe by Unemployment Among Seniors over 75 years
In terms of unemployment among seniors over 75 years, the demographic groups most similar to Immigrants from Zimbabwe are Guamanian/Chamorro (9.0%, a difference of 0.020%), Afghan (9.0%, a difference of 0.080%), Peruvian (9.0%, a difference of 0.10%), Immigrants from Jordan (9.0%, a difference of 0.16%), and Costa Rican (9.1%, a difference of 0.30%).
| Demographics | Rating | Rank | Unemployment Among Seniors over 75 years |
| Immigrants | Latin America | 13.4 /100 | #213 | Poor 9.0% |
| Immigrants | Brazil | 13.3 /100 | #214 | Poor 9.0% |
| Immigrants | Western Asia | 12.5 /100 | #215 | Poor 9.0% |
| Immigrants | Oceania | 11.8 /100 | #216 | Poor 9.0% |
| Lebanese | 11.1 /100 | #217 | Poor 9.0% |
| Immigrants | Africa | 9.7 /100 | #218 | Tragic 9.0% |
| Afghans | 8.3 /100 | #219 | Tragic 9.0% |
| Immigrants | Zimbabwe | 7.8 /100 | #220 | Tragic 9.0% |
| Guamanians/Chamorros | 7.7 /100 | #221 | Tragic 9.0% |
| Peruvians | 7.3 /100 | #222 | Tragic 9.0% |
| Immigrants | Jordan | 6.9 /100 | #223 | Tragic 9.0% |
| Costa Ricans | 6.3 /100 | #224 | Tragic 9.1% |
| Navajo | 6.1 /100 | #225 | Tragic 9.1% |
| Immigrants | Bangladesh | 5.9 /100 | #226 | Tragic 9.1% |
| Samoans | 5.7 /100 | #227 | Tragic 9.1% |