Belgian vs Immigrants from Peru Unemployment Among Ages 45 to 54 years
COMPARE
Belgian
Immigrants from Peru
Unemployment Among Ages 45 to 54 years
Unemployment Among Ages 45 to 54 years Comparison
Belgians
Immigrants from Peru
4.1%
UNEMPLOYMENT AMONG AGES 45 TO 54 YEARS
99.9/ 100
METRIC RATING
29th/ 347
METRIC RANK
4.6%
UNEMPLOYMENT AMONG AGES 45 TO 54 YEARS
19.1/ 100
METRIC RATING
202nd/ 347
METRIC RANK
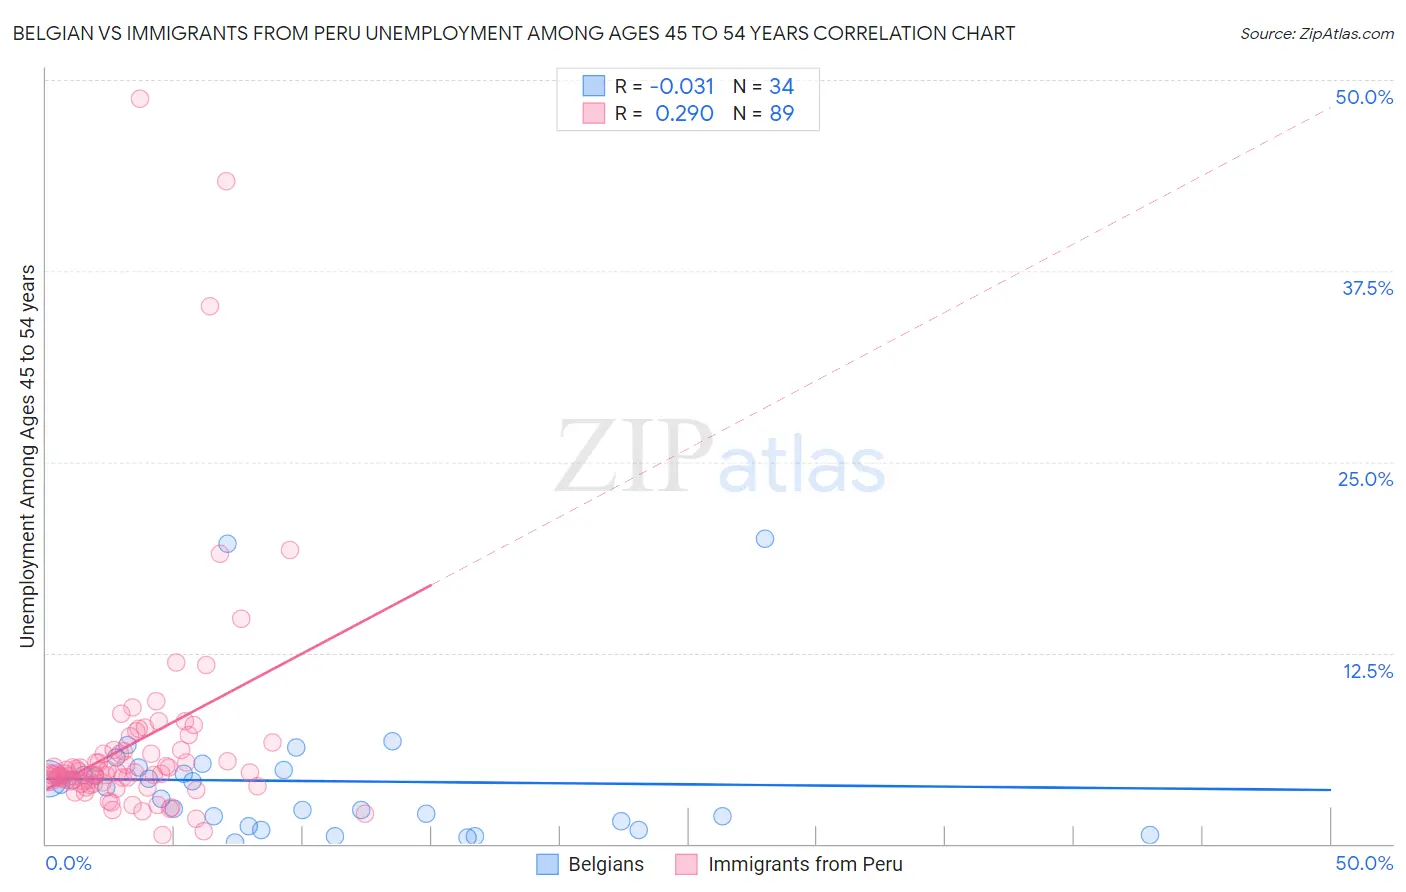
Belgian vs Immigrants from Peru Unemployment Among Ages 45 to 54 years Correlation Chart
The statistical analysis conducted on geographies consisting of 344,969,463 people shows no correlation between the proportion of Belgians and unemployment rate among population between the ages 45 and 54 in the United States with a correlation coefficient (R) of -0.031 and weighted average of 4.1%. Similarly, the statistical analysis conducted on geographies consisting of 323,495,452 people shows a weak positive correlation between the proportion of Immigrants from Peru and unemployment rate among population between the ages 45 and 54 in the United States with a correlation coefficient (R) of 0.290 and weighted average of 4.6%, a difference of 10.8%.
Unemployment Among Ages 45 to 54 years Correlation Summary
| Measurement | Belgian | Immigrants from Peru |
| Minimum | 0.10% | 0.60% |
| Maximum | 20.0% | 48.8% |
| Range | 19.9% | 48.2% |
| Mean | 4.1% | 6.6% |
| Median | 3.8% | 4.6% |
| Interquartile 25% (IQ1) | 1.5% | 4.0% |
| Interquartile 75% (IQ3) | 4.9% | 6.1% |
| Interquartile Range (IQR) | 3.4% | 2.1% |
| Standard Deviation (Sample) | 4.4% | 7.5% |
| Standard Deviation (Population) | 4.4% | 7.4% |
Similar Demographics by Unemployment Among Ages 45 to 54 years
Demographics Similar to Belgians by Unemployment Among Ages 45 to 54 years
In terms of unemployment among ages 45 to 54 years, the demographic groups most similar to Belgians are British (4.1%, a difference of 0.010%), Bhutanese (4.2%, a difference of 0.030%), Welsh (4.1%, a difference of 0.13%), Slovene (4.2%, a difference of 0.14%), and Immigrants from South Central Asia (4.2%, a difference of 0.17%).
| Demographics | Rating | Rank | Unemployment Among Ages 45 to 54 years |
| Yugoslavians | 100.0 /100 | #22 | Exceptional 4.1% |
| Bulgarians | 100.0 /100 | #23 | Exceptional 4.1% |
| Carpatho Rusyns | 100.0 /100 | #24 | Exceptional 4.1% |
| Bolivians | 99.9 /100 | #25 | Exceptional 4.1% |
| Scottish | 99.9 /100 | #26 | Exceptional 4.1% |
| Immigrants | Moldova | 99.9 /100 | #27 | Exceptional 4.1% |
| Welsh | 99.9 /100 | #28 | Exceptional 4.1% |
| Belgians | 99.9 /100 | #29 | Exceptional 4.1% |
| British | 99.9 /100 | #30 | Exceptional 4.1% |
| Bhutanese | 99.9 /100 | #31 | Exceptional 4.2% |
| Slovenes | 99.9 /100 | #32 | Exceptional 4.2% |
| Immigrants | South Central Asia | 99.9 /100 | #33 | Exceptional 4.2% |
| Dutch | 99.9 /100 | #34 | Exceptional 4.2% |
| Immigrants | Taiwan | 99.8 /100 | #35 | Exceptional 4.2% |
| Croatians | 99.8 /100 | #36 | Exceptional 4.2% |
Demographics Similar to Immigrants from Peru by Unemployment Among Ages 45 to 54 years
In terms of unemployment among ages 45 to 54 years, the demographic groups most similar to Immigrants from Peru are Liberian (4.6%, a difference of 0.030%), Immigrants from Costa Rica (4.6%, a difference of 0.040%), Immigrants from Denmark (4.6%, a difference of 0.060%), Brazilian (4.6%, a difference of 0.070%), and Immigrants from Morocco (4.6%, a difference of 0.18%).
| Demographics | Rating | Rank | Unemployment Among Ages 45 to 54 years |
| Peruvians | 31.5 /100 | #195 | Fair 4.6% |
| Estonians | 31.2 /100 | #196 | Fair 4.6% |
| Albanians | 31.1 /100 | #197 | Fair 4.6% |
| Immigrants | Belarus | 30.6 /100 | #198 | Fair 4.6% |
| Brazilians | 20.1 /100 | #199 | Fair 4.6% |
| Immigrants | Denmark | 19.8 /100 | #200 | Poor 4.6% |
| Immigrants | Costa Rica | 19.7 /100 | #201 | Poor 4.6% |
| Immigrants | Peru | 19.1 /100 | #202 | Poor 4.6% |
| Liberians | 18.7 /100 | #203 | Poor 4.6% |
| Immigrants | Morocco | 16.8 /100 | #204 | Poor 4.6% |
| Immigrants | Greece | 16.2 /100 | #205 | Poor 4.6% |
| Immigrants | Switzerland | 14.0 /100 | #206 | Poor 4.6% |
| Arabs | 13.7 /100 | #207 | Poor 4.6% |
| Immigrants | Africa | 13.6 /100 | #208 | Poor 4.6% |
| Immigrants | Nigeria | 13.3 /100 | #209 | Poor 4.6% |