Basque vs Cree Unemployment Among Ages 45 to 54 years
COMPARE
Basque
Cree
Unemployment Among Ages 45 to 54 years
Unemployment Among Ages 45 to 54 years Comparison
Basques
Cree
4.2%
UNEMPLOYMENT AMONG AGES 45 TO 54 YEARS
99.6/ 100
METRIC RATING
50th/ 347
METRIC RANK
4.7%
UNEMPLOYMENT AMONG AGES 45 TO 54 YEARS
2.3/ 100
METRIC RATING
235th/ 347
METRIC RANK
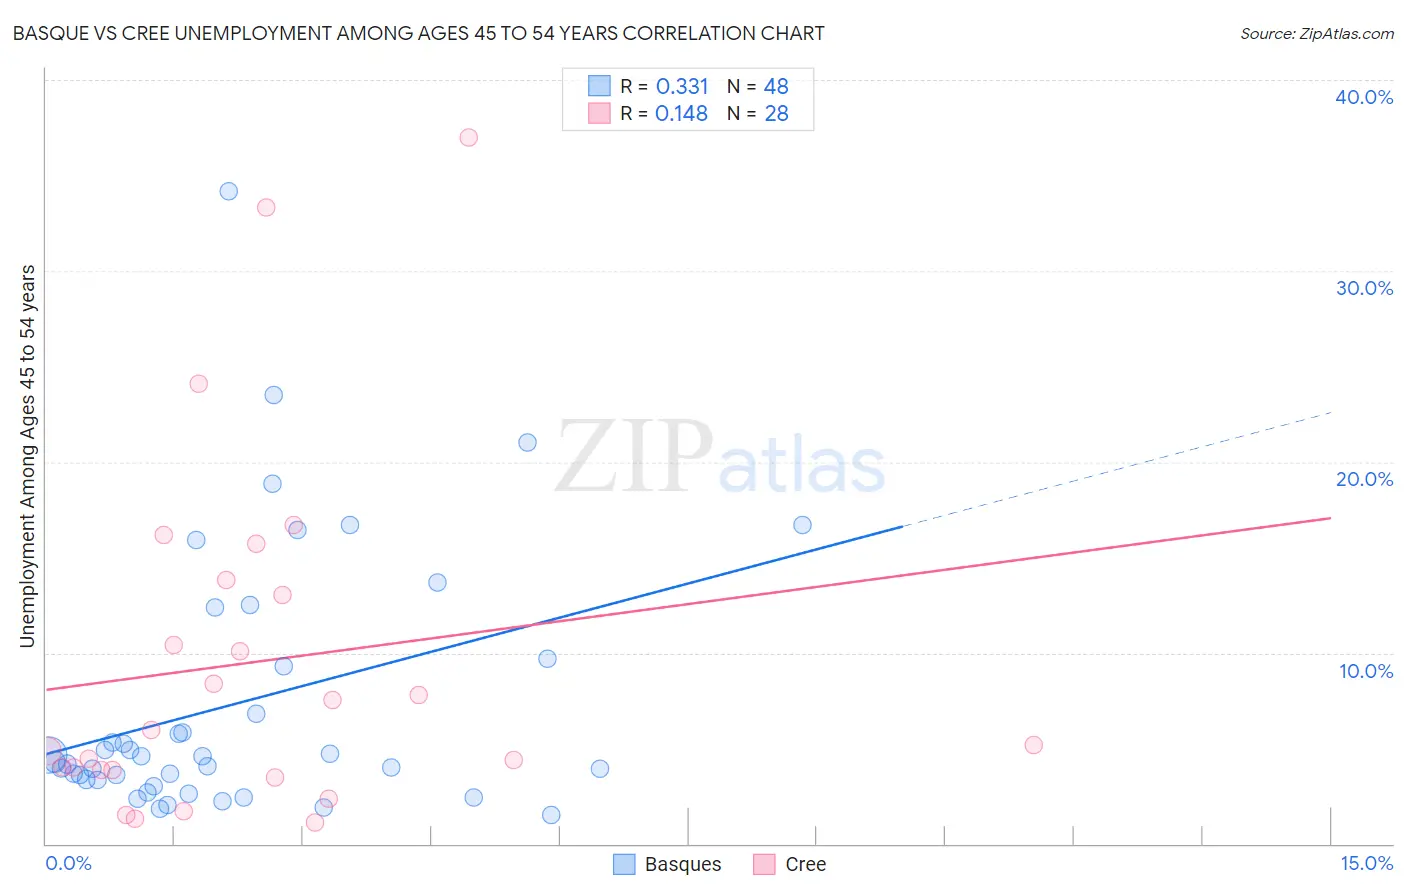
Basque vs Cree Unemployment Among Ages 45 to 54 years Correlation Chart
The statistical analysis conducted on geographies consisting of 164,045,890 people shows a mild positive correlation between the proportion of Basques and unemployment rate among population between the ages 45 and 54 in the United States with a correlation coefficient (R) of 0.331 and weighted average of 4.2%. Similarly, the statistical analysis conducted on geographies consisting of 75,499,601 people shows a poor positive correlation between the proportion of Cree and unemployment rate among population between the ages 45 and 54 in the United States with a correlation coefficient (R) of 0.148 and weighted average of 4.7%, a difference of 11.6%.
Unemployment Among Ages 45 to 54 years Correlation Summary
| Measurement | Basque | Cree |
| Minimum | 1.5% | 1.1% |
| Maximum | 34.2% | 37.0% |
| Range | 32.7% | 35.9% |
| Mean | 7.3% | 9.5% |
| Median | 4.4% | 5.6% |
| Interquartile 25% (IQ1) | 3.4% | 3.9% |
| Interquartile 75% (IQ3) | 9.5% | 13.4% |
| Interquartile Range (IQR) | 6.1% | 9.5% |
| Standard Deviation (Sample) | 6.9% | 9.2% |
| Standard Deviation (Population) | 6.8% | 9.0% |
Similar Demographics by Unemployment Among Ages 45 to 54 years
Demographics Similar to Basques by Unemployment Among Ages 45 to 54 years
In terms of unemployment among ages 45 to 54 years, the demographic groups most similar to Basques are Immigrants from Zimbabwe (4.2%, a difference of 0.010%), Burmese (4.2%, a difference of 0.010%), Finnish (4.2%, a difference of 0.040%), Filipino (4.2%, a difference of 0.12%), and Luxembourger (4.2%, a difference of 0.13%).
| Demographics | Rating | Rank | Unemployment Among Ages 45 to 54 years |
| Zimbabweans | 99.8 /100 | #43 | Exceptional 4.2% |
| Immigrants | Singapore | 99.7 /100 | #44 | Exceptional 4.2% |
| Immigrants | Bulgaria | 99.7 /100 | #45 | Exceptional 4.2% |
| Luxembourgers | 99.6 /100 | #46 | Exceptional 4.2% |
| Filipinos | 99.6 /100 | #47 | Exceptional 4.2% |
| Finns | 99.6 /100 | #48 | Exceptional 4.2% |
| Immigrants | Zimbabwe | 99.6 /100 | #49 | Exceptional 4.2% |
| Basques | 99.6 /100 | #50 | Exceptional 4.2% |
| Burmese | 99.6 /100 | #51 | Exceptional 4.2% |
| Poles | 99.5 /100 | #52 | Exceptional 4.2% |
| Irish | 99.5 /100 | #53 | Exceptional 4.2% |
| Chickasaw | 99.5 /100 | #54 | Exceptional 4.2% |
| Latvians | 99.4 /100 | #55 | Exceptional 4.2% |
| Immigrants | Jordan | 99.3 /100 | #56 | Exceptional 4.3% |
| Immigrants | Sri Lanka | 99.3 /100 | #57 | Exceptional 4.3% |
Demographics Similar to Cree by Unemployment Among Ages 45 to 54 years
In terms of unemployment among ages 45 to 54 years, the demographic groups most similar to Cree are Tlingit-Haida (4.7%, a difference of 0.010%), Soviet Union (4.7%, a difference of 0.15%), Immigrants (4.7%, a difference of 0.17%), Immigrants from Ireland (4.7%, a difference of 0.21%), and Ottawa (4.7%, a difference of 0.21%).
| Demographics | Rating | Rank | Unemployment Among Ages 45 to 54 years |
| South American Indians | 3.1 /100 | #228 | Tragic 4.7% |
| Immigrants | Israel | 3.0 /100 | #229 | Tragic 4.7% |
| Japanese | 2.8 /100 | #230 | Tragic 4.7% |
| Immigrants | Ireland | 2.7 /100 | #231 | Tragic 4.7% |
| Ottawa | 2.7 /100 | #232 | Tragic 4.7% |
| Immigrants | Immigrants | 2.6 /100 | #233 | Tragic 4.7% |
| Soviet Union | 2.6 /100 | #234 | Tragic 4.7% |
| Cree | 2.3 /100 | #235 | Tragic 4.7% |
| Tlingit-Haida | 2.3 /100 | #236 | Tragic 4.7% |
| Alsatians | 1.6 /100 | #237 | Tragic 4.7% |
| Yaqui | 1.4 /100 | #238 | Tragic 4.7% |
| Spanish Americans | 1.4 /100 | #239 | Tragic 4.7% |
| Immigrants | Iraq | 1.3 /100 | #240 | Tragic 4.7% |
| Delaware | 1.3 /100 | #241 | Tragic 4.8% |
| Central Americans | 1.3 /100 | #242 | Tragic 4.8% |