Barbadian vs Maltese Unemployment Among Ages 16 to 19 years
COMPARE
Barbadian
Maltese
Unemployment Among Ages 16 to 19 years
Unemployment Among Ages 16 to 19 years Comparison
Barbadians
Maltese
22.5%
UNEMPLOYMENT AMONG AGES 16 TO 19 YEARS
0.0/ 100
METRIC RATING
322nd/ 347
METRIC RANK
16.4%
UNEMPLOYMENT AMONG AGES 16 TO 19 YEARS
99.7/ 100
METRIC RATING
48th/ 347
METRIC RANK
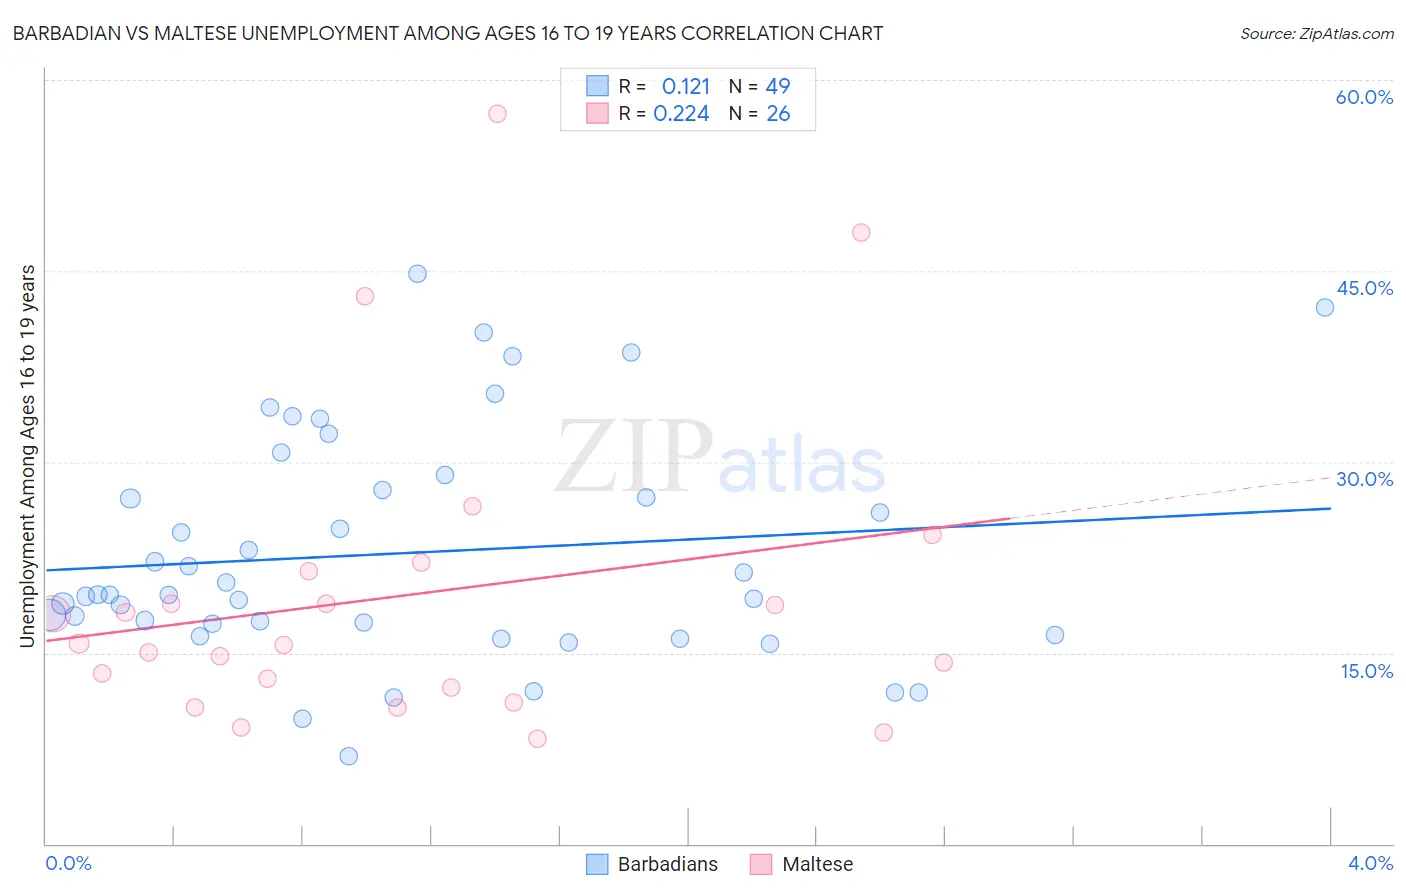
Barbadian vs Maltese Unemployment Among Ages 16 to 19 years Correlation Chart
The statistical analysis conducted on geographies consisting of 138,748,057 people shows a poor positive correlation between the proportion of Barbadians and unemployment rate among population between the ages 16 and 19 in the United States with a correlation coefficient (R) of 0.121 and weighted average of 22.5%. Similarly, the statistical analysis conducted on geographies consisting of 123,062,483 people shows a weak positive correlation between the proportion of Maltese and unemployment rate among population between the ages 16 and 19 in the United States with a correlation coefficient (R) of 0.224 and weighted average of 16.4%, a difference of 37.2%.
Unemployment Among Ages 16 to 19 years Correlation Summary
| Measurement | Barbadian | Maltese |
| Minimum | 6.8% | 8.3% |
| Maximum | 44.7% | 57.3% |
| Range | 37.9% | 49.0% |
| Mean | 22.8% | 19.5% |
| Median | 19.6% | 15.7% |
| Interquartile 25% (IQ1) | 16.8% | 12.2% |
| Interquartile 75% (IQ3) | 28.4% | 21.4% |
| Interquartile Range (IQR) | 11.6% | 9.2% |
| Standard Deviation (Sample) | 9.0% | 12.2% |
| Standard Deviation (Population) | 8.9% | 11.9% |
Similar Demographics by Unemployment Among Ages 16 to 19 years
Demographics Similar to Barbadians by Unemployment Among Ages 16 to 19 years
In terms of unemployment among ages 16 to 19 years, the demographic groups most similar to Barbadians are West Indian (22.4%, a difference of 0.14%), Yakama (22.5%, a difference of 0.22%), Immigrants from Armenia (22.6%, a difference of 0.68%), Trinidadian and Tobagonian (22.6%, a difference of 0.79%), and Cheyenne (22.3%, a difference of 0.83%).
| Demographics | Rating | Rank | Unemployment Among Ages 16 to 19 years |
| Immigrants | Dominica | 0.0 /100 | #315 | Tragic 21.9% |
| Tohono O'odham | 0.0 /100 | #316 | Tragic 22.1% |
| Immigrants | Belize | 0.0 /100 | #317 | Tragic 22.2% |
| Immigrants | Jamaica | 0.0 /100 | #318 | Tragic 22.2% |
| Immigrants | West Indies | 0.0 /100 | #319 | Tragic 22.2% |
| Cheyenne | 0.0 /100 | #320 | Tragic 22.3% |
| West Indians | 0.0 /100 | #321 | Tragic 22.4% |
| Barbadians | 0.0 /100 | #322 | Tragic 22.5% |
| Yakama | 0.0 /100 | #323 | Tragic 22.5% |
| Immigrants | Armenia | 0.0 /100 | #324 | Tragic 22.6% |
| Trinidadians and Tobagonians | 0.0 /100 | #325 | Tragic 22.6% |
| Immigrants | Trinidad and Tobago | 0.0 /100 | #326 | Tragic 23.1% |
| Pima | 0.0 /100 | #327 | Tragic 23.1% |
| Immigrants | Dominican Republic | 0.0 /100 | #328 | Tragic 23.3% |
| Tlingit-Haida | 0.0 /100 | #329 | Tragic 23.5% |
Demographics Similar to Maltese by Unemployment Among Ages 16 to 19 years
In terms of unemployment among ages 16 to 19 years, the demographic groups most similar to Maltese are Immigrants from Vietnam (16.4%, a difference of 0.040%), Iraqi (16.4%, a difference of 0.070%), Immigrants from North Macedonia (16.4%, a difference of 0.11%), Polish (16.4%, a difference of 0.14%), and Immigrants from Zimbabwe (16.3%, a difference of 0.15%).
| Demographics | Rating | Rank | Unemployment Among Ages 16 to 19 years |
| Immigrants | Nepal | 99.8 /100 | #41 | Exceptional 16.3% |
| Fijians | 99.8 /100 | #42 | Exceptional 16.3% |
| Immigrants | Lebanon | 99.8 /100 | #43 | Exceptional 16.3% |
| Immigrants | Zimbabwe | 99.7 /100 | #44 | Exceptional 16.3% |
| Poles | 99.7 /100 | #45 | Exceptional 16.4% |
| Immigrants | North Macedonia | 99.7 /100 | #46 | Exceptional 16.4% |
| Immigrants | Vietnam | 99.7 /100 | #47 | Exceptional 16.4% |
| Maltese | 99.7 /100 | #48 | Exceptional 16.4% |
| Iraqis | 99.7 /100 | #49 | Exceptional 16.4% |
| Bhutanese | 99.6 /100 | #50 | Exceptional 16.4% |
| Lebanese | 99.6 /100 | #51 | Exceptional 16.4% |
| Welsh | 99.6 /100 | #52 | Exceptional 16.4% |
| Slovenes | 99.6 /100 | #53 | Exceptional 16.4% |
| British | 99.5 /100 | #54 | Exceptional 16.5% |
| Czechoslovakians | 99.5 /100 | #55 | Exceptional 16.5% |