Bangladeshi vs Immigrants from Belize Unemployment Among Ages 45 to 54 years
COMPARE
Bangladeshi
Immigrants from Belize
Unemployment Among Ages 45 to 54 years
Unemployment Among Ages 45 to 54 years Comparison
Bangladeshis
Immigrants from Belize
4.5%
UNEMPLOYMENT AMONG AGES 45 TO 54 YEARS
59.7/ 100
METRIC RATING
163rd/ 347
METRIC RANK
5.3%
UNEMPLOYMENT AMONG AGES 45 TO 54 YEARS
0.0/ 100
METRIC RATING
303rd/ 347
METRIC RANK
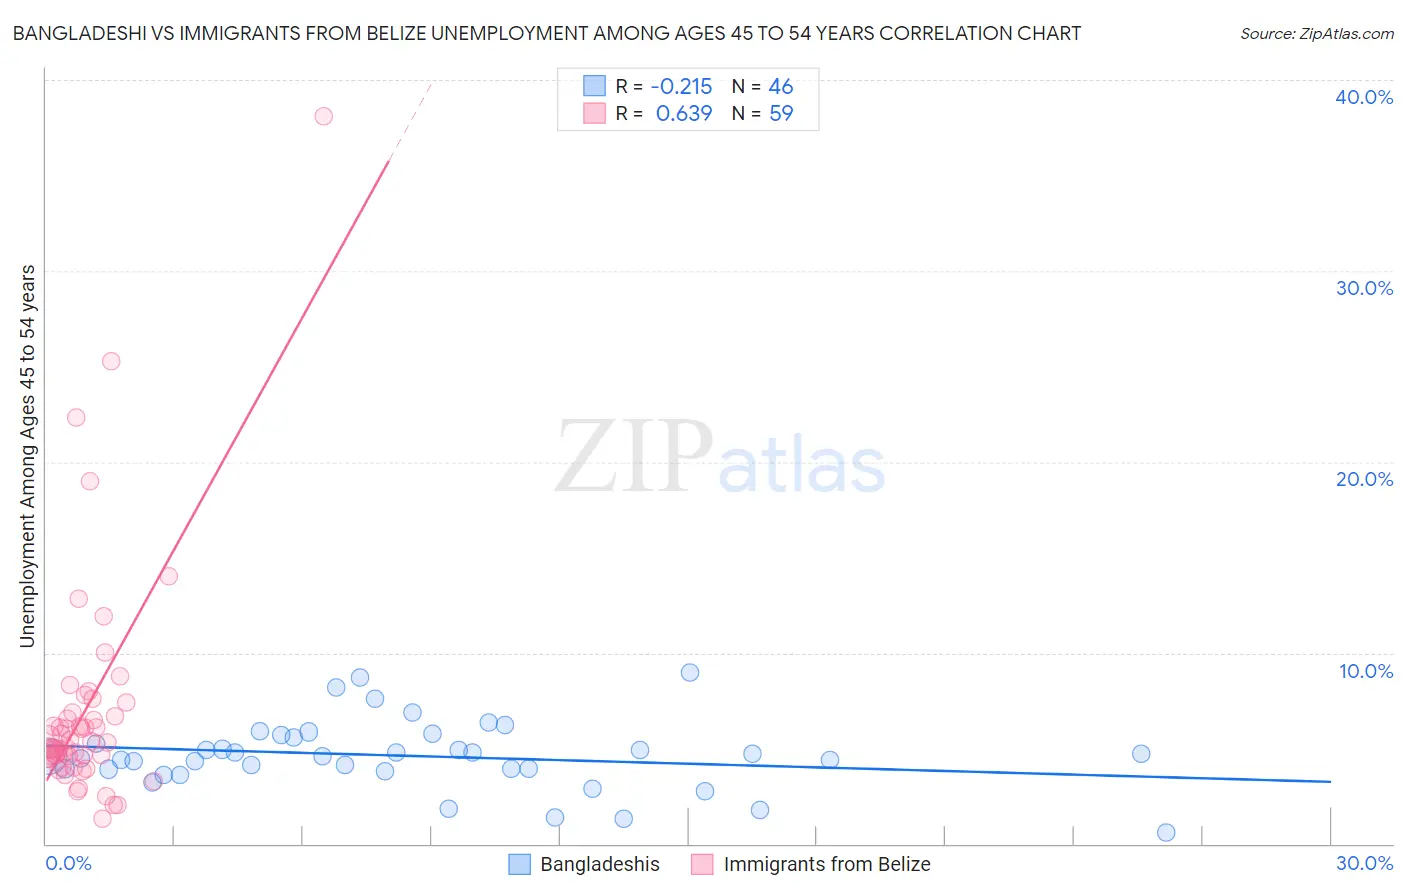
Bangladeshi vs Immigrants from Belize Unemployment Among Ages 45 to 54 years Correlation Chart
The statistical analysis conducted on geographies consisting of 139,604,321 people shows a weak negative correlation between the proportion of Bangladeshis and unemployment rate among population between the ages 45 and 54 in the United States with a correlation coefficient (R) of -0.215 and weighted average of 4.5%. Similarly, the statistical analysis conducted on geographies consisting of 129,652,080 people shows a significant positive correlation between the proportion of Immigrants from Belize and unemployment rate among population between the ages 45 and 54 in the United States with a correlation coefficient (R) of 0.639 and weighted average of 5.3%, a difference of 18.7%.
Unemployment Among Ages 45 to 54 years Correlation Summary
| Measurement | Bangladeshi | Immigrants from Belize |
| Minimum | 0.60% | 1.3% |
| Maximum | 9.0% | 38.1% |
| Range | 8.4% | 36.8% |
| Mean | 4.6% | 7.0% |
| Median | 4.6% | 5.3% |
| Interquartile 25% (IQ1) | 3.9% | 4.6% |
| Interquartile 75% (IQ3) | 5.6% | 6.9% |
| Interquartile Range (IQR) | 1.7% | 2.3% |
| Standard Deviation (Sample) | 1.8% | 6.0% |
| Standard Deviation (Population) | 1.8% | 6.0% |
Similar Demographics by Unemployment Among Ages 45 to 54 years
Demographics Similar to Bangladeshis by Unemployment Among Ages 45 to 54 years
In terms of unemployment among ages 45 to 54 years, the demographic groups most similar to Bangladeshis are Immigrants from Indonesia (4.5%, a difference of 0.030%), Samoan (4.5%, a difference of 0.060%), Immigrants from Eastern Europe (4.5%, a difference of 0.090%), Maltese (4.5%, a difference of 0.090%), and Immigrants from South Eastern Asia (4.5%, a difference of 0.11%).
| Demographics | Rating | Rank | Unemployment Among Ages 45 to 54 years |
| Immigrants | Croatia | 69.6 /100 | #156 | Good 4.5% |
| Indians (Asian) | 68.1 /100 | #157 | Good 4.5% |
| Immigrants | Italy | 65.5 /100 | #158 | Good 4.5% |
| Immigrants | Nonimmigrants | 62.8 /100 | #159 | Good 4.5% |
| Immigrants | South Eastern Asia | 62.0 /100 | #160 | Good 4.5% |
| Immigrants | Eastern Europe | 61.6 /100 | #161 | Good 4.5% |
| Immigrants | Indonesia | 60.3 /100 | #162 | Good 4.5% |
| Bangladeshis | 59.7 /100 | #163 | Average 4.5% |
| Samoans | 58.5 /100 | #164 | Average 4.5% |
| Maltese | 57.9 /100 | #165 | Average 4.5% |
| Immigrants | Western Europe | 57.4 /100 | #166 | Average 4.5% |
| Immigrants | Brazil | 56.4 /100 | #167 | Average 4.5% |
| Immigrants | Europe | 54.7 /100 | #168 | Average 4.5% |
| Immigrants | Egypt | 54.7 /100 | #169 | Average 4.5% |
| Spaniards | 54.3 /100 | #170 | Average 4.5% |
Demographics Similar to Immigrants from Belize by Unemployment Among Ages 45 to 54 years
In terms of unemployment among ages 45 to 54 years, the demographic groups most similar to Immigrants from Belize are Immigrants from Ecuador (5.3%, a difference of 0.10%), Immigrants from Jamaica (5.4%, a difference of 0.18%), Immigrants from West Indies (5.4%, a difference of 0.35%), Immigrants from Bangladesh (5.4%, a difference of 0.51%), and Vietnamese (5.4%, a difference of 0.77%).
| Demographics | Rating | Rank | Unemployment Among Ages 45 to 54 years |
| Aleuts | 0.0 /100 | #296 | Tragic 5.3% |
| West Indians | 0.0 /100 | #297 | Tragic 5.3% |
| Immigrants | Trinidad and Tobago | 0.0 /100 | #298 | Tragic 5.3% |
| Ecuadorians | 0.0 /100 | #299 | Tragic 5.3% |
| Central American Indians | 0.0 /100 | #300 | Tragic 5.3% |
| Menominee | 0.0 /100 | #301 | Tragic 5.3% |
| Immigrants | Ecuador | 0.0 /100 | #302 | Tragic 5.3% |
| Immigrants | Belize | 0.0 /100 | #303 | Tragic 5.3% |
| Immigrants | Jamaica | 0.0 /100 | #304 | Tragic 5.4% |
| Immigrants | West Indies | 0.0 /100 | #305 | Tragic 5.4% |
| Immigrants | Bangladesh | 0.0 /100 | #306 | Tragic 5.4% |
| Vietnamese | 0.0 /100 | #307 | Tragic 5.4% |
| Blacks/African Americans | 0.0 /100 | #308 | Tragic 5.4% |
| Barbadians | 0.0 /100 | #309 | Tragic 5.5% |
| Immigrants | Barbados | 0.0 /100 | #310 | Tragic 5.5% |