Bahamian vs Immigrants from Saudi Arabia Unemployment Among Ages 60 to 64 years
COMPARE
Bahamian
Immigrants from Saudi Arabia
Unemployment Among Ages 60 to 64 years
Unemployment Among Ages 60 to 64 years Comparison
Bahamians
Immigrants from Saudi Arabia
5.4%
UNEMPLOYMENT AMONG AGES 60 TO 64 YEARS
0.0/ 100
METRIC RATING
303rd/ 347
METRIC RANK
4.7%
UNEMPLOYMENT AMONG AGES 60 TO 64 YEARS
98.3/ 100
METRIC RATING
93rd/ 347
METRIC RANK
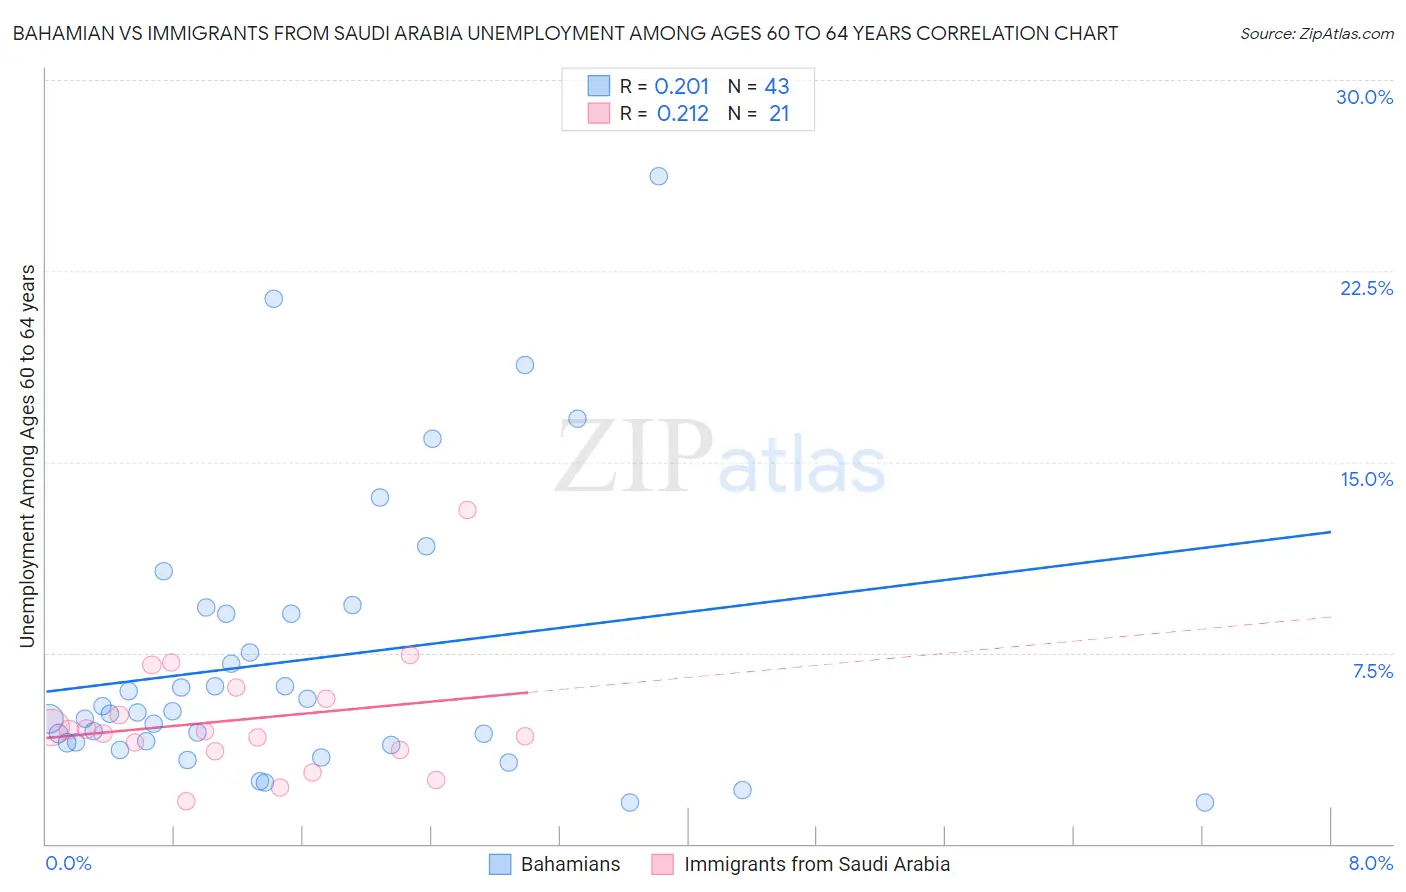
Bahamian vs Immigrants from Saudi Arabia Unemployment Among Ages 60 to 64 years Correlation Chart
The statistical analysis conducted on geographies consisting of 107,952,782 people shows a weak positive correlation between the proportion of Bahamians and unemployment rate among population between the ages 60 and 64 in the United States with a correlation coefficient (R) of 0.201 and weighted average of 5.4%. Similarly, the statistical analysis conducted on geographies consisting of 157,511,946 people shows a weak positive correlation between the proportion of Immigrants from Saudi Arabia and unemployment rate among population between the ages 60 and 64 in the United States with a correlation coefficient (R) of 0.212 and weighted average of 4.7%, a difference of 15.1%.
Unemployment Among Ages 60 to 64 years Correlation Summary
| Measurement | Bahamian | Immigrants from Saudi Arabia |
| Minimum | 1.6% | 1.7% |
| Maximum | 26.2% | 13.1% |
| Range | 24.6% | 11.4% |
| Mean | 7.2% | 4.9% |
| Median | 5.1% | 4.4% |
| Interquartile 25% (IQ1) | 4.0% | 3.7% |
| Interquartile 75% (IQ3) | 9.0% | 5.9% |
| Interquartile Range (IQR) | 5.1% | 2.3% |
| Standard Deviation (Sample) | 5.5% | 2.4% |
| Standard Deviation (Population) | 5.4% | 2.4% |
Similar Demographics by Unemployment Among Ages 60 to 64 years
Demographics Similar to Bahamians by Unemployment Among Ages 60 to 64 years
In terms of unemployment among ages 60 to 64 years, the demographic groups most similar to Bahamians are Immigrants from Mexico (5.4%, a difference of 0.050%), Cypriot (5.4%, a difference of 0.070%), Barbadian (5.4%, a difference of 0.10%), Immigrants from Dominica (5.4%, a difference of 0.14%), and Immigrants from Guyana (5.4%, a difference of 0.31%).
| Demographics | Rating | Rank | Unemployment Among Ages 60 to 64 years |
| Jamaicans | 0.0 /100 | #296 | Tragic 5.3% |
| Osage | 0.0 /100 | #297 | Tragic 5.4% |
| Immigrants | Central America | 0.0 /100 | #298 | Tragic 5.4% |
| Immigrants | El Salvador | 0.0 /100 | #299 | Tragic 5.4% |
| Immigrants | Barbados | 0.0 /100 | #300 | Tragic 5.4% |
| Immigrants | Jamaica | 0.0 /100 | #301 | Tragic 5.4% |
| Barbadians | 0.0 /100 | #302 | Tragic 5.4% |
| Bahamians | 0.0 /100 | #303 | Tragic 5.4% |
| Immigrants | Mexico | 0.0 /100 | #304 | Tragic 5.4% |
| Cypriots | 0.0 /100 | #305 | Tragic 5.4% |
| Immigrants | Dominica | 0.0 /100 | #306 | Tragic 5.4% |
| Immigrants | Guyana | 0.0 /100 | #307 | Tragic 5.4% |
| Spanish American Indians | 0.0 /100 | #308 | Tragic 5.4% |
| Soviet Union | 0.0 /100 | #309 | Tragic 5.4% |
| British West Indians | 0.0 /100 | #310 | Tragic 5.5% |
Demographics Similar to Immigrants from Saudi Arabia by Unemployment Among Ages 60 to 64 years
In terms of unemployment among ages 60 to 64 years, the demographic groups most similar to Immigrants from Saudi Arabia are Immigrants from Kuwait (4.7%, a difference of 0.010%), Romanian (4.7%, a difference of 0.020%), Immigrants from Uganda (4.7%, a difference of 0.050%), Serbian (4.7%, a difference of 0.080%), and Polish (4.7%, a difference of 0.10%).
| Demographics | Rating | Rank | Unemployment Among Ages 60 to 64 years |
| Immigrants | Oceania | 98.9 /100 | #86 | Exceptional 4.7% |
| Immigrants | Jordan | 98.8 /100 | #87 | Exceptional 4.7% |
| Immigrants | Bulgaria | 98.7 /100 | #88 | Exceptional 4.7% |
| Immigrants | Northern Africa | 98.7 /100 | #89 | Exceptional 4.7% |
| Immigrants | Liberia | 98.7 /100 | #90 | Exceptional 4.7% |
| Immigrants | Uganda | 98.4 /100 | #91 | Exceptional 4.7% |
| Romanians | 98.4 /100 | #92 | Exceptional 4.7% |
| Immigrants | Saudi Arabia | 98.3 /100 | #93 | Exceptional 4.7% |
| Immigrants | Kuwait | 98.3 /100 | #94 | Exceptional 4.7% |
| Serbians | 98.2 /100 | #95 | Exceptional 4.7% |
| Poles | 98.1 /100 | #96 | Exceptional 4.7% |
| Immigrants | Albania | 98.0 /100 | #97 | Exceptional 4.7% |
| Somalis | 98.0 /100 | #98 | Exceptional 4.7% |
| Egyptians | 98.0 /100 | #99 | Exceptional 4.7% |
| Portuguese | 97.9 /100 | #100 | Exceptional 4.7% |