Bahamian vs Ethiopian Unemployment Among Ages 16 to 19 years
COMPARE
Bahamian
Ethiopian
Unemployment Among Ages 16 to 19 years
Unemployment Among Ages 16 to 19 years Comparison
Bahamians
Ethiopians
19.8%
UNEMPLOYMENT AMONG AGES 16 TO 19 YEARS
0.0/ 100
METRIC RATING
286th/ 347
METRIC RANK
17.8%
UNEMPLOYMENT AMONG AGES 16 TO 19 YEARS
29.6/ 100
METRIC RATING
198th/ 347
METRIC RANK
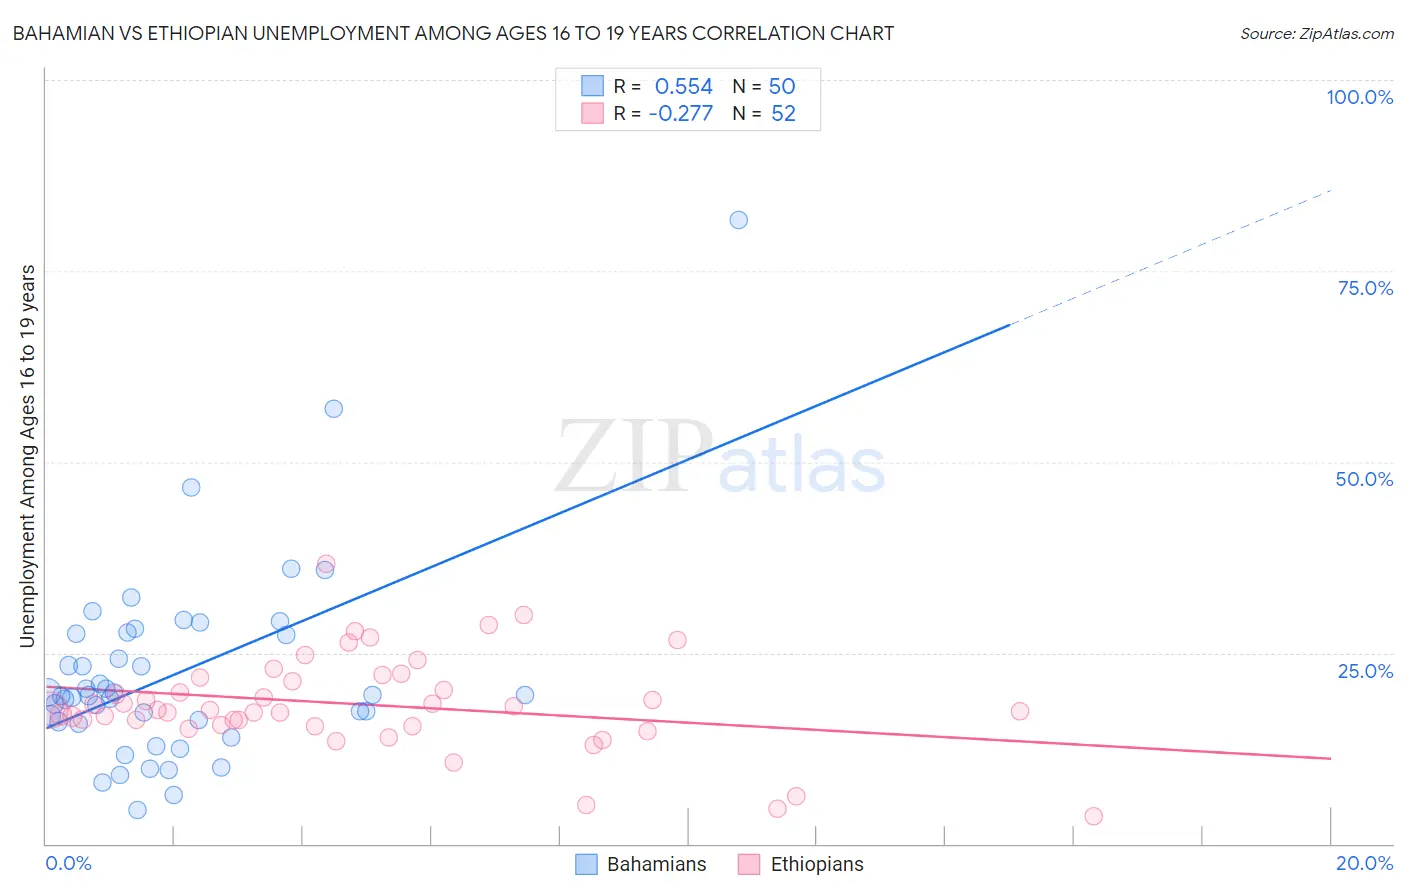
Bahamian vs Ethiopian Unemployment Among Ages 16 to 19 years Correlation Chart
The statistical analysis conducted on geographies consisting of 110,790,423 people shows a substantial positive correlation between the proportion of Bahamians and unemployment rate among population between the ages 16 and 19 in the United States with a correlation coefficient (R) of 0.554 and weighted average of 19.8%. Similarly, the statistical analysis conducted on geographies consisting of 217,412,763 people shows a weak negative correlation between the proportion of Ethiopians and unemployment rate among population between the ages 16 and 19 in the United States with a correlation coefficient (R) of -0.277 and weighted average of 17.8%, a difference of 11.4%.
Unemployment Among Ages 16 to 19 years Correlation Summary
| Measurement | Bahamian | Ethiopian |
| Minimum | 4.4% | 3.6% |
| Maximum | 81.7% | 36.6% |
| Range | 77.3% | 33.0% |
| Mean | 22.2% | 18.2% |
| Median | 19.4% | 17.5% |
| Interquartile 25% (IQ1) | 16.0% | 15.5% |
| Interquartile 75% (IQ3) | 27.5% | 21.6% |
| Interquartile Range (IQR) | 11.5% | 6.1% |
| Standard Deviation (Sample) | 13.0% | 6.3% |
| Standard Deviation (Population) | 12.9% | 6.2% |
Similar Demographics by Unemployment Among Ages 16 to 19 years
Demographics Similar to Bahamians by Unemployment Among Ages 16 to 19 years
In terms of unemployment among ages 16 to 19 years, the demographic groups most similar to Bahamians are Immigrants from Ghana (19.8%, a difference of 0.060%), Ghanaian (19.8%, a difference of 0.12%), Immigrants from the Azores (19.8%, a difference of 0.18%), Sierra Leonean (19.7%, a difference of 0.30%), and Sioux (19.7%, a difference of 0.31%).
| Demographics | Rating | Rank | Unemployment Among Ages 16 to 19 years |
| Ute | 0.0 /100 | #279 | Tragic 19.6% |
| Cajuns | 0.0 /100 | #280 | Tragic 19.6% |
| Cypriots | 0.0 /100 | #281 | Tragic 19.6% |
| Dutch West Indians | 0.0 /100 | #282 | Tragic 19.7% |
| Sioux | 0.0 /100 | #283 | Tragic 19.7% |
| Sierra Leoneans | 0.0 /100 | #284 | Tragic 19.7% |
| Ghanaians | 0.0 /100 | #285 | Tragic 19.8% |
| Bahamians | 0.0 /100 | #286 | Tragic 19.8% |
| Immigrants | Ghana | 0.0 /100 | #287 | Tragic 19.8% |
| Immigrants | Azores | 0.0 /100 | #288 | Tragic 19.8% |
| Pueblo | 0.0 /100 | #289 | Tragic 19.8% |
| Immigrants | Sierra Leone | 0.0 /100 | #290 | Tragic 20.0% |
| Immigrants | Yemen | 0.0 /100 | #291 | Tragic 20.0% |
| Comanche | 0.0 /100 | #292 | Tragic 20.2% |
| Immigrants | Bahamas | 0.0 /100 | #293 | Tragic 20.4% |
Demographics Similar to Ethiopians by Unemployment Among Ages 16 to 19 years
In terms of unemployment among ages 16 to 19 years, the demographic groups most similar to Ethiopians are Immigrants from Czechoslovakia (17.8%, a difference of 0.010%), Immigrants from Ireland (17.8%, a difference of 0.060%), Immigrants from Fiji (17.8%, a difference of 0.11%), Immigrants from Ethiopia (17.8%, a difference of 0.13%), and Immigrants from Portugal (17.8%, a difference of 0.14%).
| Demographics | Rating | Rank | Unemployment Among Ages 16 to 19 years |
| Immigrants | Costa Rica | 41.3 /100 | #191 | Average 17.6% |
| Immigrants | Philippines | 40.7 /100 | #192 | Average 17.7% |
| Immigrants | Australia | 40.6 /100 | #193 | Average 17.7% |
| Peruvians | 38.8 /100 | #194 | Fair 17.7% |
| Immigrants | Peru | 37.3 /100 | #195 | Fair 17.7% |
| Alaskan Athabascans | 34.1 /100 | #196 | Fair 17.7% |
| Immigrants | Czechoslovakia | 29.8 /100 | #197 | Fair 17.8% |
| Ethiopians | 29.6 /100 | #198 | Fair 17.8% |
| Immigrants | Ireland | 28.5 /100 | #199 | Fair 17.8% |
| Immigrants | Fiji | 27.7 /100 | #200 | Fair 17.8% |
| Immigrants | Ethiopia | 27.4 /100 | #201 | Fair 17.8% |
| Immigrants | Portugal | 27.2 /100 | #202 | Fair 17.8% |
| Immigrants | Eastern Europe | 23.6 /100 | #203 | Fair 17.8% |
| Immigrants | Nonimmigrants | 20.9 /100 | #204 | Fair 17.9% |
| Assyrians/Chaldeans/Syriacs | 20.8 /100 | #205 | Fair 17.9% |