Austrian vs European Unemployment Among Seniors over 65 years
COMPARE
Austrian
European
Unemployment Among Seniors over 65 years
Unemployment Among Seniors over 65 years Comparison
Austrians
Europeans
5.0%
UNEMPLOYMENT AMONG SENIORS OVER 65 YEARS
97.3/ 100
METRIC RATING
93rd/ 347
METRIC RANK
4.9%
UNEMPLOYMENT AMONG SENIORS OVER 65 YEARS
99.8/ 100
METRIC RATING
55th/ 347
METRIC RANK
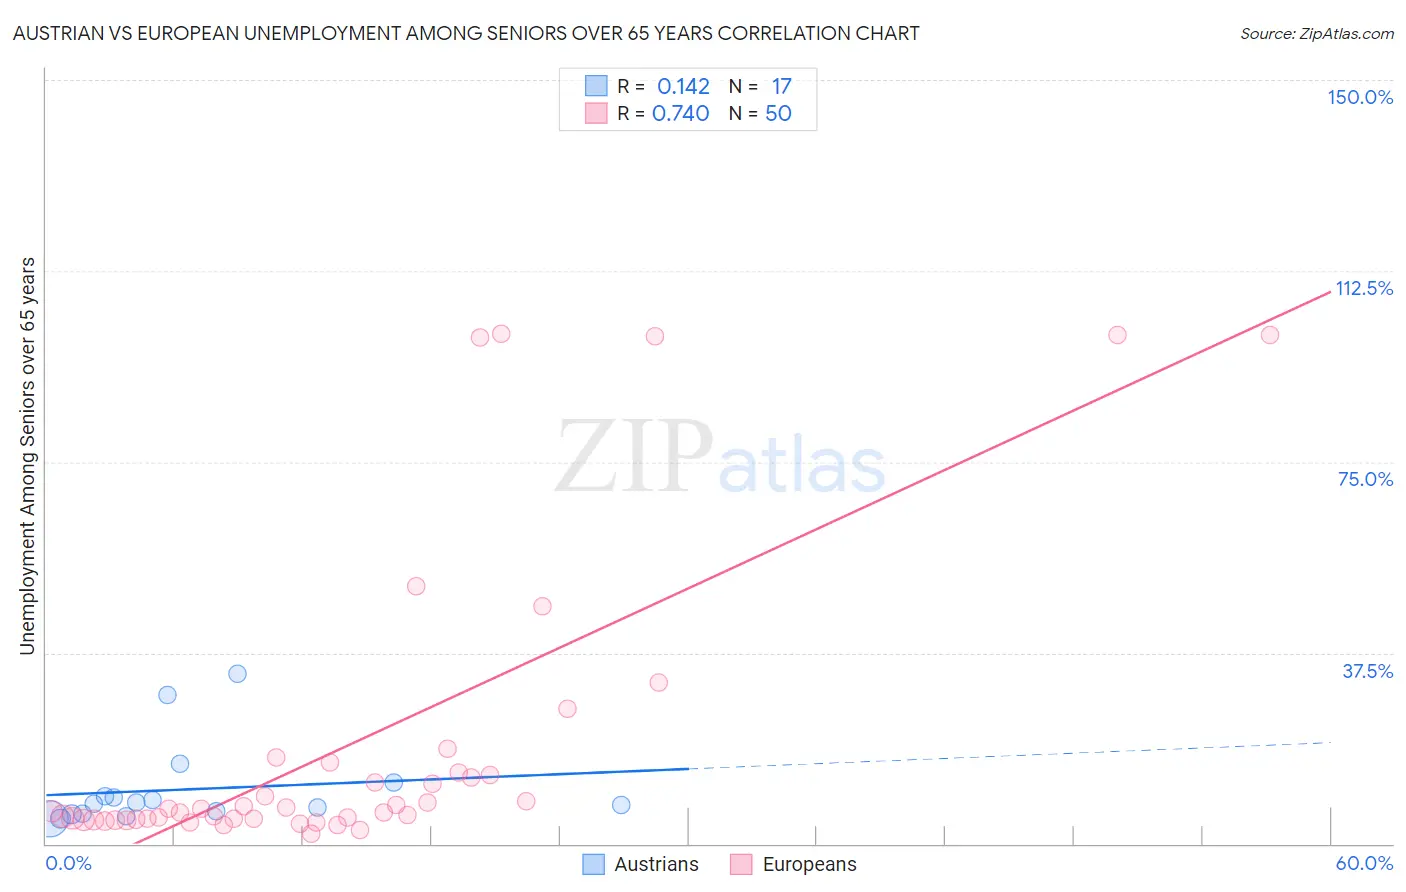
Austrian vs European Unemployment Among Seniors over 65 years Correlation Chart
The statistical analysis conducted on geographies consisting of 395,268,536 people shows a poor positive correlation between the proportion of Austrians and unemployment rate amomg seniors over the age of 65 in the United States with a correlation coefficient (R) of 0.142 and weighted average of 5.0%. Similarly, the statistical analysis conducted on geographies consisting of 457,694,683 people shows a strong positive correlation between the proportion of Europeans and unemployment rate amomg seniors over the age of 65 in the United States with a correlation coefficient (R) of 0.740 and weighted average of 4.9%, a difference of 2.4%.
Unemployment Among Seniors over 65 years Correlation Summary
| Measurement | Austrian | European |
| Minimum | 4.8% | 2.0% |
| Maximum | 33.3% | 100.1% |
| Range | 28.5% | 98.1% |
| Mean | 10.6% | 19.0% |
| Median | 7.8% | 6.6% |
| Interquartile 25% (IQ1) | 5.8% | 4.9% |
| Interquartile 75% (IQ3) | 10.6% | 14.0% |
| Interquartile Range (IQR) | 4.8% | 9.1% |
| Standard Deviation (Sample) | 8.3% | 28.9% |
| Standard Deviation (Population) | 8.0% | 28.6% |
Similar Demographics by Unemployment Among Seniors over 65 years
Demographics Similar to Austrians by Unemployment Among Seniors over 65 years
In terms of unemployment among seniors over 65 years, the demographic groups most similar to Austrians are Immigrants from Bulgaria (5.0%, a difference of 0.0%), Immigrants from Bolivia (5.0%, a difference of 0.020%), Immigrants from South Africa (5.0%, a difference of 0.10%), Immigrants from South Central Asia (5.0%, a difference of 0.11%), and Afghan (5.0%, a difference of 0.12%).
| Demographics | Rating | Rank | Unemployment Among Seniors over 65 years |
| Immigrants | Taiwan | 98.2 /100 | #86 | Exceptional 5.0% |
| Immigrants | Switzerland | 98.2 /100 | #87 | Exceptional 5.0% |
| Afghans | 97.6 /100 | #88 | Exceptional 5.0% |
| Immigrants | South Central Asia | 97.6 /100 | #89 | Exceptional 5.0% |
| Immigrants | South Africa | 97.6 /100 | #90 | Exceptional 5.0% |
| Immigrants | Bolivia | 97.3 /100 | #91 | Exceptional 5.0% |
| Immigrants | Bulgaria | 97.3 /100 | #92 | Exceptional 5.0% |
| Austrians | 97.3 /100 | #93 | Exceptional 5.0% |
| Burmese | 96.8 /100 | #94 | Exceptional 5.0% |
| Assyrians/Chaldeans/Syriacs | 96.8 /100 | #95 | Exceptional 5.0% |
| Immigrants | Singapore | 96.8 /100 | #96 | Exceptional 5.0% |
| Immigrants | Oceania | 96.8 /100 | #97 | Exceptional 5.0% |
| Czechoslovakians | 96.7 /100 | #98 | Exceptional 5.0% |
| South Africans | 96.5 /100 | #99 | Exceptional 5.0% |
| Romanians | 95.5 /100 | #100 | Exceptional 5.0% |
Demographics Similar to Europeans by Unemployment Among Seniors over 65 years
In terms of unemployment among seniors over 65 years, the demographic groups most similar to Europeans are Immigrants from Iraq (4.9%, a difference of 0.010%), Carpatho Rusyn (4.9%, a difference of 0.060%), Immigrants from Sudan (4.9%, a difference of 0.070%), Danish (4.9%, a difference of 0.10%), and Scandinavian (4.9%, a difference of 0.11%).
| Demographics | Rating | Rank | Unemployment Among Seniors over 65 years |
| Choctaw | 99.9 /100 | #48 | Exceptional 4.9% |
| Immigrants | Kenya | 99.9 /100 | #49 | Exceptional 4.9% |
| Immigrants | Austria | 99.9 /100 | #50 | Exceptional 4.9% |
| Scotch-Irish | 99.9 /100 | #51 | Exceptional 4.9% |
| Swedes | 99.9 /100 | #52 | Exceptional 4.9% |
| Immigrants | Sudan | 99.8 /100 | #53 | Exceptional 4.9% |
| Immigrants | Iraq | 99.8 /100 | #54 | Exceptional 4.9% |
| Europeans | 99.8 /100 | #55 | Exceptional 4.9% |
| Carpatho Rusyns | 99.8 /100 | #56 | Exceptional 4.9% |
| Danes | 99.8 /100 | #57 | Exceptional 4.9% |
| Scandinavians | 99.8 /100 | #58 | Exceptional 4.9% |
| Immigrants | Eastern Africa | 99.7 /100 | #59 | Exceptional 4.9% |
| Immigrants | Middle Africa | 99.7 /100 | #60 | Exceptional 4.9% |
| Northern Europeans | 99.7 /100 | #61 | Exceptional 4.9% |
| Latvians | 99.6 /100 | #62 | Exceptional 4.9% |