Australian vs Immigrants from St. Vincent and the Grenadines Unemployment Among Ages 45 to 54 years
COMPARE
Australian
Immigrants from St. Vincent and the Grenadines
Unemployment Among Ages 45 to 54 years
Unemployment Among Ages 45 to 54 years Comparison
Australians
Immigrants from St. Vincent and the Grenadines
4.3%
UNEMPLOYMENT AMONG AGES 45 TO 54 YEARS
97.4/ 100
METRIC RATING
83rd/ 347
METRIC RANK
5.7%
UNEMPLOYMENT AMONG AGES 45 TO 54 YEARS
0.0/ 100
METRIC RATING
320th/ 347
METRIC RANK
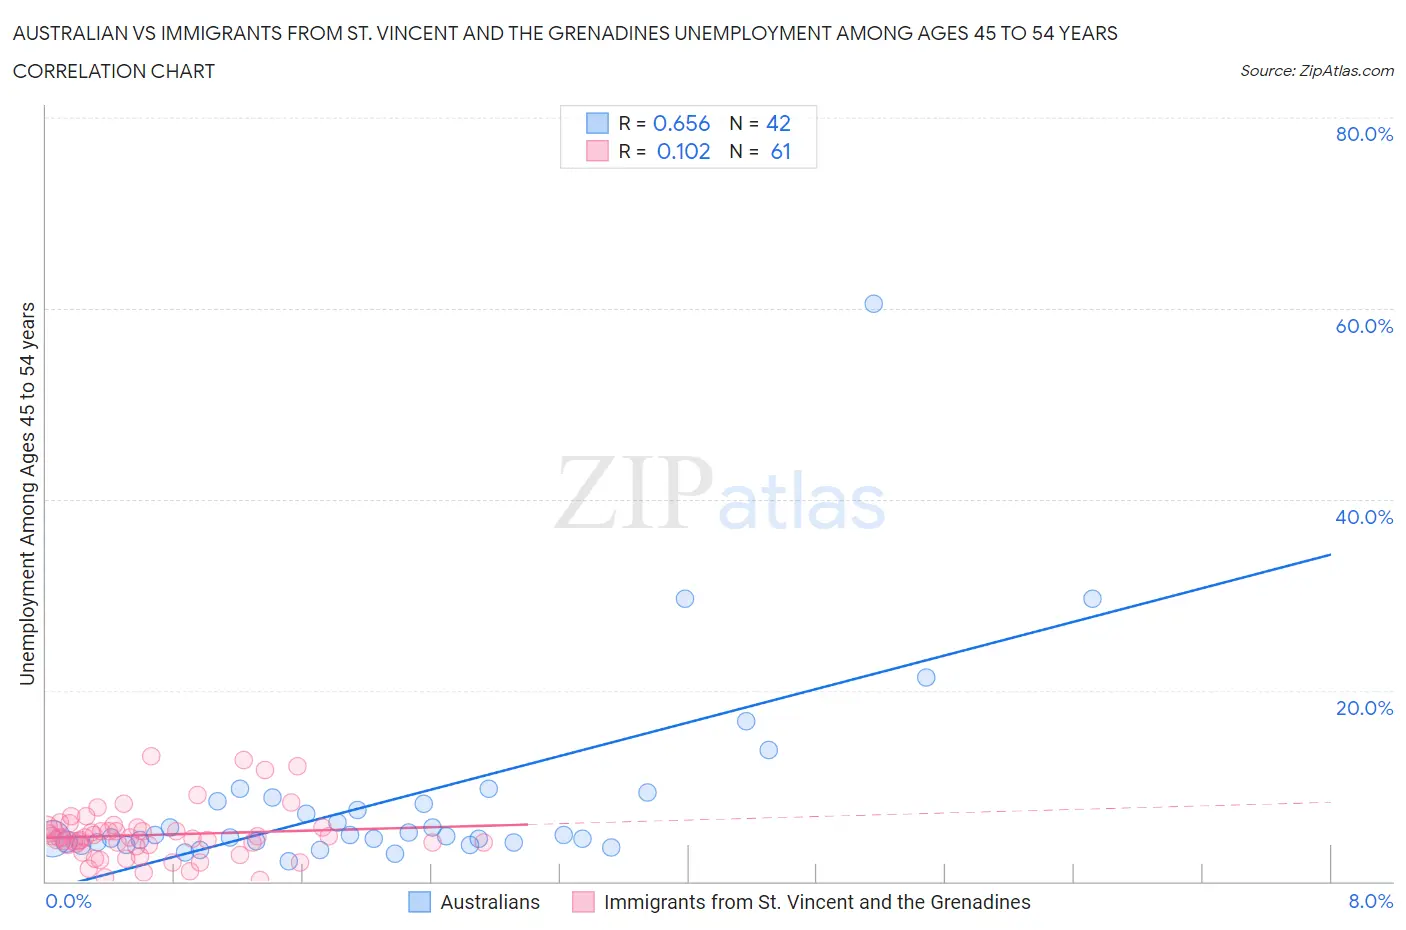
Australian vs Immigrants from St. Vincent and the Grenadines Unemployment Among Ages 45 to 54 years Correlation Chart
The statistical analysis conducted on geographies consisting of 220,525,115 people shows a significant positive correlation between the proportion of Australians and unemployment rate among population between the ages 45 and 54 in the United States with a correlation coefficient (R) of 0.656 and weighted average of 4.3%. Similarly, the statistical analysis conducted on geographies consisting of 56,012,006 people shows a poor positive correlation between the proportion of Immigrants from St. Vincent and the Grenadines and unemployment rate among population between the ages 45 and 54 in the United States with a correlation coefficient (R) of 0.102 and weighted average of 5.7%, a difference of 31.6%.
Unemployment Among Ages 45 to 54 years Correlation Summary
| Measurement | Australian | Immigrants from St. Vincent and the Grenadines |
| Minimum | 2.1% | 0.10% |
| Maximum | 60.5% | 13.1% |
| Range | 58.4% | 13.0% |
| Mean | 8.5% | 4.9% |
| Median | 4.8% | 4.5% |
| Interquartile 25% (IQ1) | 4.1% | 3.7% |
| Interquartile 75% (IQ3) | 8.4% | 5.6% |
| Interquartile Range (IQR) | 4.3% | 1.9% |
| Standard Deviation (Sample) | 10.4% | 2.7% |
| Standard Deviation (Population) | 10.2% | 2.7% |
Similar Demographics by Unemployment Among Ages 45 to 54 years
Demographics Similar to Australians by Unemployment Among Ages 45 to 54 years
In terms of unemployment among ages 45 to 54 years, the demographic groups most similar to Australians are Italian (4.3%, a difference of 0.040%), French (4.3%, a difference of 0.040%), Eastern European (4.3%, a difference of 0.080%), Ethiopian (4.3%, a difference of 0.080%), and Immigrants from Micronesia (4.3%, a difference of 0.11%).
| Demographics | Rating | Rank | Unemployment Among Ages 45 to 54 years |
| Slavs | 98.1 /100 | #76 | Exceptional 4.3% |
| Chileans | 98.1 /100 | #77 | Exceptional 4.3% |
| German Russians | 97.9 /100 | #78 | Exceptional 4.3% |
| Serbians | 97.9 /100 | #79 | Exceptional 4.3% |
| Cambodians | 97.8 /100 | #80 | Exceptional 4.3% |
| Immigrants | Micronesia | 97.6 /100 | #81 | Exceptional 4.3% |
| Eastern Europeans | 97.6 /100 | #82 | Exceptional 4.3% |
| Australians | 97.4 /100 | #83 | Exceptional 4.3% |
| Italians | 97.3 /100 | #84 | Exceptional 4.3% |
| French | 97.3 /100 | #85 | Exceptional 4.3% |
| Ethiopians | 97.2 /100 | #86 | Exceptional 4.3% |
| Sudanese | 97.0 /100 | #87 | Exceptional 4.3% |
| Immigrants | Turkey | 96.9 /100 | #88 | Exceptional 4.3% |
| Immigrants | Argentina | 96.9 /100 | #89 | Exceptional 4.3% |
| Asians | 96.8 /100 | #90 | Exceptional 4.3% |
Demographics Similar to Immigrants from St. Vincent and the Grenadines by Unemployment Among Ages 45 to 54 years
In terms of unemployment among ages 45 to 54 years, the demographic groups most similar to Immigrants from St. Vincent and the Grenadines are Cape Verdean (5.7%, a difference of 0.010%), Yakama (5.7%, a difference of 0.35%), British West Indian (5.7%, a difference of 0.55%), Immigrants from the Azores (5.7%, a difference of 0.86%), and Houma (5.6%, a difference of 1.2%).
| Demographics | Rating | Rank | Unemployment Among Ages 45 to 54 years |
| Shoshone | 0.0 /100 | #313 | Tragic 5.6% |
| Guyanese | 0.0 /100 | #314 | Tragic 5.6% |
| Immigrants | Dominica | 0.0 /100 | #315 | Tragic 5.6% |
| Immigrants | Guyana | 0.0 /100 | #316 | Tragic 5.6% |
| Houma | 0.0 /100 | #317 | Tragic 5.6% |
| British West Indians | 0.0 /100 | #318 | Tragic 5.7% |
| Cape Verdeans | 0.0 /100 | #319 | Tragic 5.7% |
| Immigrants | St. Vincent and the Grenadines | 0.0 /100 | #320 | Tragic 5.7% |
| Yakama | 0.0 /100 | #321 | Tragic 5.7% |
| Immigrants | Azores | 0.0 /100 | #322 | Tragic 5.7% |
| Immigrants | Cabo Verde | 0.0 /100 | #323 | Tragic 5.9% |
| Natives/Alaskans | 0.0 /100 | #324 | Tragic 6.1% |
| Immigrants | Armenia | 0.0 /100 | #325 | Tragic 6.1% |
| Ute | 0.0 /100 | #326 | Tragic 6.2% |
| Dominicans | 0.0 /100 | #327 | Tragic 6.2% |