Armenian vs Shoshone Unemployment Among Ages 55 to 59 years
COMPARE
Armenian
Shoshone
Unemployment Among Ages 55 to 59 years
Unemployment Among Ages 55 to 59 years Comparison
Armenians
Shoshone
5.3%
UNEMPLOYMENT AMONG AGES 55 TO 59 YEARS
0.0/ 100
METRIC RATING
285th/ 347
METRIC RANK
7.4%
UNEMPLOYMENT AMONG AGES 55 TO 59 YEARS
0.0/ 100
METRIC RATING
341st/ 347
METRIC RANK
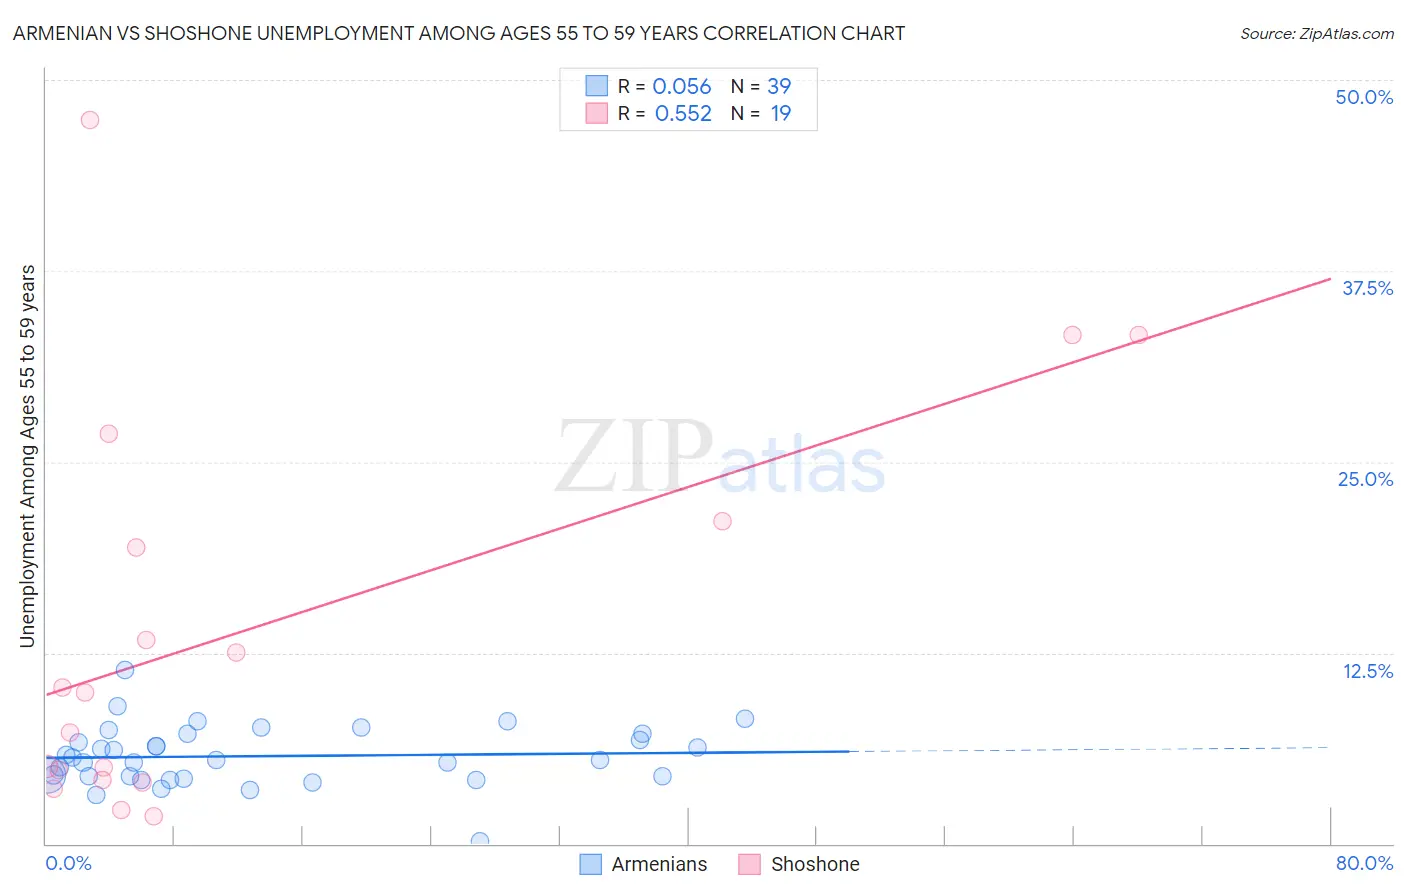
Armenian vs Shoshone Unemployment Among Ages 55 to 59 years Correlation Chart
The statistical analysis conducted on geographies consisting of 295,177,302 people shows a slight positive correlation between the proportion of Armenians and unemployment rate among population between the ages 55 and 59 in the United States with a correlation coefficient (R) of 0.056 and weighted average of 5.3%. Similarly, the statistical analysis conducted on geographies consisting of 64,919,646 people shows a substantial positive correlation between the proportion of Shoshone and unemployment rate among population between the ages 55 and 59 in the United States with a correlation coefficient (R) of 0.552 and weighted average of 7.4%, a difference of 39.5%.
Unemployment Among Ages 55 to 59 years Correlation Summary
| Measurement | Armenian | Shoshone |
| Minimum | 0.20% | 1.8% |
| Maximum | 11.4% | 47.4% |
| Range | 11.2% | 45.6% |
| Mean | 5.7% | 14.0% |
| Median | 5.5% | 9.9% |
| Interquartile 25% (IQ1) | 4.4% | 4.2% |
| Interquartile 75% (IQ3) | 7.2% | 21.1% |
| Interquartile Range (IQR) | 2.8% | 16.9% |
| Standard Deviation (Sample) | 2.0% | 13.0% |
| Standard Deviation (Population) | 1.9% | 12.6% |
Similar Demographics by Unemployment Among Ages 55 to 59 years
Demographics Similar to Armenians by Unemployment Among Ages 55 to 59 years
In terms of unemployment among ages 55 to 59 years, the demographic groups most similar to Armenians are Ghanaian (5.3%, a difference of 0.10%), Immigrants from Ghana (5.3%, a difference of 0.12%), Apache (5.3%, a difference of 0.14%), Immigrants from Guatemala (5.3%, a difference of 0.14%), and Immigrants from Israel (5.3%, a difference of 0.15%).
| Demographics | Rating | Rank | Unemployment Among Ages 55 to 59 years |
| Immigrants | Barbados | 0.0 /100 | #278 | Tragic 5.2% |
| Alsatians | 0.0 /100 | #279 | Tragic 5.2% |
| Immigrants | Uzbekistan | 0.0 /100 | #280 | Tragic 5.3% |
| Guatemalans | 0.0 /100 | #281 | Tragic 5.3% |
| Immigrants | Trinidad and Tobago | 0.0 /100 | #282 | Tragic 5.3% |
| Apache | 0.0 /100 | #283 | Tragic 5.3% |
| Ghanaians | 0.0 /100 | #284 | Tragic 5.3% |
| Armenians | 0.0 /100 | #285 | Tragic 5.3% |
| Immigrants | Ghana | 0.0 /100 | #286 | Tragic 5.3% |
| Immigrants | Guatemala | 0.0 /100 | #287 | Tragic 5.3% |
| Immigrants | Israel | 0.0 /100 | #288 | Tragic 5.3% |
| Immigrants | Central America | 0.0 /100 | #289 | Tragic 5.3% |
| Sioux | 0.0 /100 | #290 | Tragic 5.3% |
| Trinidadians and Tobagonians | 0.0 /100 | #291 | Tragic 5.3% |
| British West Indians | 0.0 /100 | #292 | Tragic 5.3% |
Demographics Similar to Shoshone by Unemployment Among Ages 55 to 59 years
In terms of unemployment among ages 55 to 59 years, the demographic groups most similar to Shoshone are Alaskan Athabascan (7.1%, a difference of 3.3%), Puerto Rican (7.0%, a difference of 5.9%), Immigrants from Yemen (6.9%, a difference of 7.0%), Paiute (6.8%, a difference of 9.1%), and Navajo (6.7%, a difference of 9.7%).
| Demographics | Rating | Rank | Unemployment Among Ages 55 to 59 years |
| Pima | 0.0 /100 | #333 | Tragic 6.6% |
| Pueblo | 0.0 /100 | #334 | Tragic 6.7% |
| Colville | 0.0 /100 | #335 | Tragic 6.7% |
| Navajo | 0.0 /100 | #336 | Tragic 6.7% |
| Paiute | 0.0 /100 | #337 | Tragic 6.8% |
| Immigrants | Yemen | 0.0 /100 | #338 | Tragic 6.9% |
| Puerto Ricans | 0.0 /100 | #339 | Tragic 7.0% |
| Alaskan Athabascans | 0.0 /100 | #340 | Tragic 7.1% |
| Shoshone | 0.0 /100 | #341 | Tragic 7.4% |
| Hopi | 0.0 /100 | #342 | Tragic 8.1% |
| Yakama | 0.0 /100 | #343 | Tragic 8.9% |
| Inupiat | 0.0 /100 | #344 | Tragic 9.0% |
| Tohono O'odham | 0.0 /100 | #345 | Tragic 9.3% |
| Menominee | 0.0 /100 | #346 | Tragic 10.5% |
| Yup'ik | 0.0 /100 | #347 | Tragic 13.9% |