Argentinean vs Lithuanian Unemployment Among Ages 16 to 19 years
COMPARE
Argentinean
Lithuanian
Unemployment Among Ages 16 to 19 years
Unemployment Among Ages 16 to 19 years Comparison
Argentineans
Lithuanians
18.0%
UNEMPLOYMENT AMONG AGES 16 TO 19 YEARS
13.8/ 100
METRIC RATING
212th/ 347
METRIC RANK
16.7%
UNEMPLOYMENT AMONG AGES 16 TO 19 YEARS
98.2/ 100
METRIC RATING
73rd/ 347
METRIC RANK
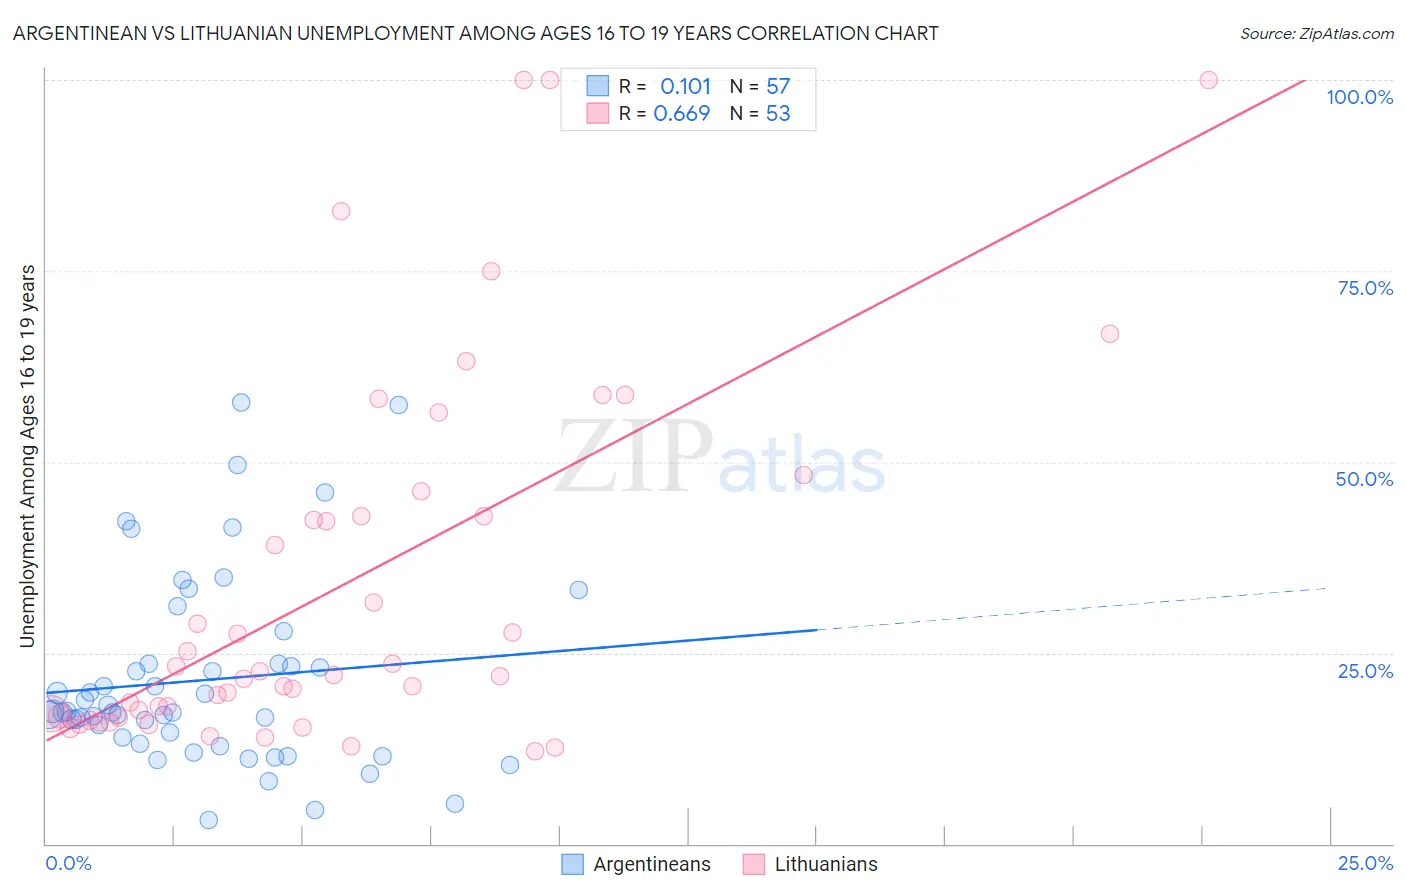
Argentinean vs Lithuanian Unemployment Among Ages 16 to 19 years Correlation Chart
The statistical analysis conducted on geographies consisting of 286,014,670 people shows a poor positive correlation between the proportion of Argentineans and unemployment rate among population between the ages 16 and 19 in the United States with a correlation coefficient (R) of 0.101 and weighted average of 18.0%. Similarly, the statistical analysis conducted on geographies consisting of 394,472,378 people shows a significant positive correlation between the proportion of Lithuanians and unemployment rate among population between the ages 16 and 19 in the United States with a correlation coefficient (R) of 0.669 and weighted average of 16.7%, a difference of 7.2%.
Unemployment Among Ages 16 to 19 years Correlation Summary
| Measurement | Argentinean | Lithuanian |
| Minimum | 3.1% | 12.2% |
| Maximum | 57.7% | 100.0% |
| Range | 54.6% | 87.8% |
| Mean | 21.4% | 33.9% |
| Median | 17.2% | 22.1% |
| Interquartile 25% (IQ1) | 13.5% | 16.6% |
| Interquartile 75% (IQ3) | 23.6% | 44.5% |
| Interquartile Range (IQR) | 10.0% | 27.9% |
| Standard Deviation (Sample) | 12.4% | 24.2% |
| Standard Deviation (Population) | 12.3% | 24.0% |
Similar Demographics by Unemployment Among Ages 16 to 19 years
Demographics Similar to Argentineans by Unemployment Among Ages 16 to 19 years
In terms of unemployment among ages 16 to 19 years, the demographic groups most similar to Argentineans are Chippewa (18.0%, a difference of 0.010%), Immigrants from Morocco (18.0%, a difference of 0.030%), Immigrants from Syria (18.0%, a difference of 0.050%), Guamanian/Chamorro (17.9%, a difference of 0.060%), and Immigrants from Kazakhstan (18.0%, a difference of 0.090%).
| Demographics | Rating | Rank | Unemployment Among Ages 16 to 19 years |
| Assyrians/Chaldeans/Syriacs | 20.8 /100 | #205 | Fair 17.9% |
| Immigrants | Southern Europe | 18.9 /100 | #206 | Poor 17.9% |
| Liberians | 18.6 /100 | #207 | Poor 17.9% |
| Hawaiians | 16.8 /100 | #208 | Poor 17.9% |
| Cherokee | 15.7 /100 | #209 | Poor 17.9% |
| Carpatho Rusyns | 15.6 /100 | #210 | Poor 17.9% |
| Guamanians/Chamorros | 14.5 /100 | #211 | Poor 17.9% |
| Argentineans | 13.8 /100 | #212 | Poor 18.0% |
| Chippewa | 13.7 /100 | #213 | Poor 18.0% |
| Immigrants | Morocco | 13.5 /100 | #214 | Poor 18.0% |
| Immigrants | Syria | 13.3 /100 | #215 | Poor 18.0% |
| Immigrants | Kazakhstan | 13.0 /100 | #216 | Poor 18.0% |
| South American Indians | 13.0 /100 | #217 | Poor 18.0% |
| Immigrants | Argentina | 12.5 /100 | #218 | Poor 18.0% |
| Immigrants | Africa | 12.0 /100 | #219 | Poor 18.0% |
Demographics Similar to Lithuanians by Unemployment Among Ages 16 to 19 years
In terms of unemployment among ages 16 to 19 years, the demographic groups most similar to Lithuanians are Immigrants from Eastern Africa (16.8%, a difference of 0.030%), New Zealander (16.8%, a difference of 0.090%), Immigrants from North America (16.8%, a difference of 0.16%), Immigrants from Singapore (16.8%, a difference of 0.22%), and Immigrants from Canada (16.7%, a difference of 0.24%).
| Demographics | Rating | Rank | Unemployment Among Ages 16 to 19 years |
| Okinawans | 98.9 /100 | #66 | Exceptional 16.6% |
| Slavs | 98.7 /100 | #67 | Exceptional 16.7% |
| Chickasaw | 98.7 /100 | #68 | Exceptional 16.7% |
| Serbians | 98.7 /100 | #69 | Exceptional 16.7% |
| Austrians | 98.6 /100 | #70 | Exceptional 16.7% |
| Latvians | 98.5 /100 | #71 | Exceptional 16.7% |
| Immigrants | Canada | 98.5 /100 | #72 | Exceptional 16.7% |
| Lithuanians | 98.2 /100 | #73 | Exceptional 16.7% |
| Immigrants | Eastern Africa | 98.1 /100 | #74 | Exceptional 16.8% |
| New Zealanders | 98.0 /100 | #75 | Exceptional 16.8% |
| Immigrants | North America | 97.9 /100 | #76 | Exceptional 16.8% |
| Immigrants | Singapore | 97.8 /100 | #77 | Exceptional 16.8% |
| Soviet Union | 97.8 /100 | #78 | Exceptional 16.8% |
| Slovaks | 97.5 /100 | #79 | Exceptional 16.8% |
| French Canadians | 97.5 /100 | #80 | Exceptional 16.8% |