Apache vs Slovene Unemployment Among Ages 25 to 29 years
COMPARE
Apache
Slovene
Unemployment Among Ages 25 to 29 years
Unemployment Among Ages 25 to 29 years Comparison
Apache
Slovenes
9.5%
UNEMPLOYMENT AMONG AGES 25 TO 29 YEARS
0.0/ 100
METRIC RATING
328th/ 347
METRIC RANK
6.3%
UNEMPLOYMENT AMONG AGES 25 TO 29 YEARS
95.3/ 100
METRIC RATING
83rd/ 347
METRIC RANK
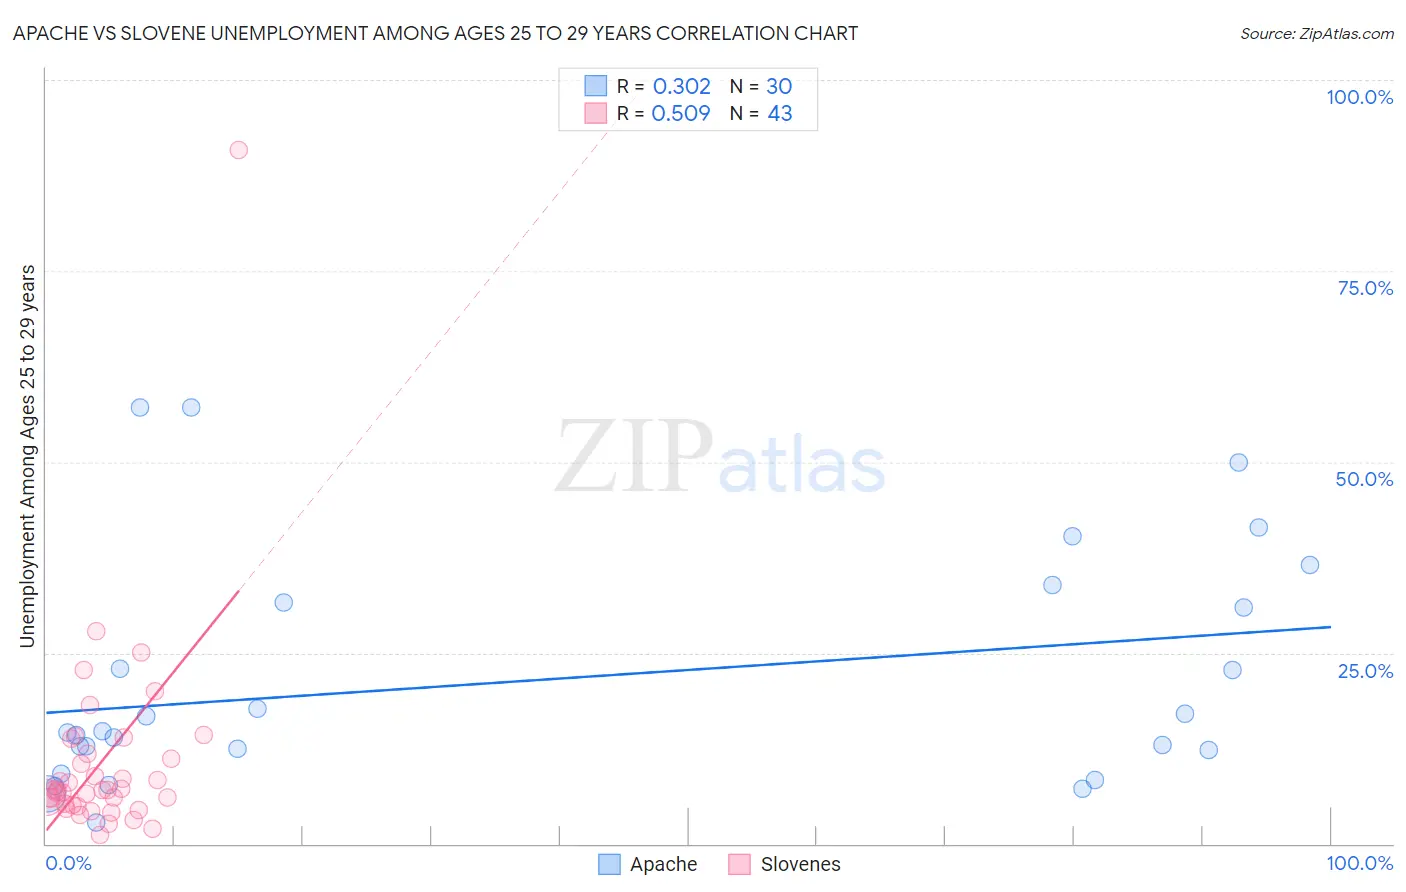
Apache vs Slovene Unemployment Among Ages 25 to 29 years Correlation Chart
The statistical analysis conducted on geographies consisting of 224,498,621 people shows a mild positive correlation between the proportion of Apache and unemployment rate among population between the ages 25 and 29 in the United States with a correlation coefficient (R) of 0.302 and weighted average of 9.5%. Similarly, the statistical analysis conducted on geographies consisting of 249,419,398 people shows a substantial positive correlation between the proportion of Slovenes and unemployment rate among population between the ages 25 and 29 in the United States with a correlation coefficient (R) of 0.509 and weighted average of 6.3%, a difference of 49.6%.
Unemployment Among Ages 25 to 29 years Correlation Summary
| Measurement | Apache | Slovene |
| Minimum | 2.8% | 1.2% |
| Maximum | 57.1% | 90.9% |
| Range | 54.3% | 89.7% |
| Mean | 21.5% | 10.9% |
| Median | 14.6% | 7.1% |
| Interquartile 25% (IQ1) | 12.3% | 5.0% |
| Interquartile 75% (IQ3) | 31.6% | 11.8% |
| Interquartile Range (IQR) | 19.3% | 6.7% |
| Standard Deviation (Sample) | 15.3% | 13.9% |
| Standard Deviation (Population) | 15.1% | 13.7% |
Similar Demographics by Unemployment Among Ages 25 to 29 years
Demographics Similar to Apache by Unemployment Among Ages 25 to 29 years
In terms of unemployment among ages 25 to 29 years, the demographic groups most similar to Apache are Aleut (9.7%, a difference of 2.2%), Colville (9.2%, a difference of 2.6%), Shoshone (9.2%, a difference of 2.8%), Native/Alaskan (9.8%, a difference of 3.6%), and Alaska Native (10.2%, a difference of 7.5%).
| Demographics | Rating | Rank | Unemployment Among Ages 25 to 29 years |
| Immigrants | Dominican Republic | 0.0 /100 | #321 | Tragic 8.6% |
| Tlingit-Haida | 0.0 /100 | #322 | Tragic 8.7% |
| Dominicans | 0.0 /100 | #323 | Tragic 8.7% |
| Houma | 0.0 /100 | #324 | Tragic 8.7% |
| Yakama | 0.0 /100 | #325 | Tragic 8.8% |
| Shoshone | 0.0 /100 | #326 | Tragic 9.2% |
| Colville | 0.0 /100 | #327 | Tragic 9.2% |
| Apache | 0.0 /100 | #328 | Tragic 9.5% |
| Aleuts | 0.0 /100 | #329 | Tragic 9.7% |
| Natives/Alaskans | 0.0 /100 | #330 | Tragic 9.8% |
| Alaska Natives | 0.0 /100 | #331 | Tragic 10.2% |
| Pueblo | 0.0 /100 | #332 | Tragic 10.4% |
| Alaskan Athabascans | 0.0 /100 | #333 | Tragic 10.8% |
| Yuman | 0.0 /100 | #334 | Tragic 11.0% |
| Puerto Ricans | 0.0 /100 | #335 | Tragic 11.1% |
Demographics Similar to Slovenes by Unemployment Among Ages 25 to 29 years
In terms of unemployment among ages 25 to 29 years, the demographic groups most similar to Slovenes are Immigrants from Spain (6.3%, a difference of 0.040%), Immigrants from Sweden (6.3%, a difference of 0.060%), Immigrants from Poland (6.3%, a difference of 0.13%), Immigrants from Asia (6.3%, a difference of 0.16%), and Iranian (6.3%, a difference of 0.17%).
| Demographics | Rating | Rank | Unemployment Among Ages 25 to 29 years |
| Immigrants | Korea | 96.7 /100 | #76 | Exceptional 6.3% |
| Icelanders | 96.6 /100 | #77 | Exceptional 6.3% |
| Asians | 96.4 /100 | #78 | Exceptional 6.3% |
| Immigrants | Switzerland | 96.0 /100 | #79 | Exceptional 6.3% |
| Immigrants | Romania | 95.9 /100 | #80 | Exceptional 6.3% |
| Iranians | 95.8 /100 | #81 | Exceptional 6.3% |
| Immigrants | Poland | 95.7 /100 | #82 | Exceptional 6.3% |
| Slovenes | 95.3 /100 | #83 | Exceptional 6.3% |
| Immigrants | Spain | 95.2 /100 | #84 | Exceptional 6.3% |
| Immigrants | Sweden | 95.1 /100 | #85 | Exceptional 6.3% |
| Immigrants | Asia | 94.9 /100 | #86 | Exceptional 6.3% |
| Marshallese | 94.7 /100 | #87 | Exceptional 6.4% |
| Immigrants | Indonesia | 94.5 /100 | #88 | Exceptional 6.4% |
| Immigrants | Oceania | 94.1 /100 | #89 | Exceptional 6.4% |
| Lebanese | 93.9 /100 | #90 | Exceptional 6.4% |