Apache vs Immigrants from Southern Europe Unemployment Among Women with Children Under 18 years
COMPARE
Apache
Immigrants from Southern Europe
Unemployment Among Women with Children Under 18 years
Unemployment Among Women with Children Under 18 years Comparison
Apache
Immigrants from Southern Europe
7.9%
UNEMPLOYMENT AMONG WOMEN WITH CHILDREN UNDER 18 YEARS
0.0/ 100
METRIC RATING
335th/ 347
METRIC RANK
5.5%
UNEMPLOYMENT AMONG WOMEN WITH CHILDREN UNDER 18 YEARS
42.7/ 100
METRIC RATING
180th/ 347
METRIC RANK
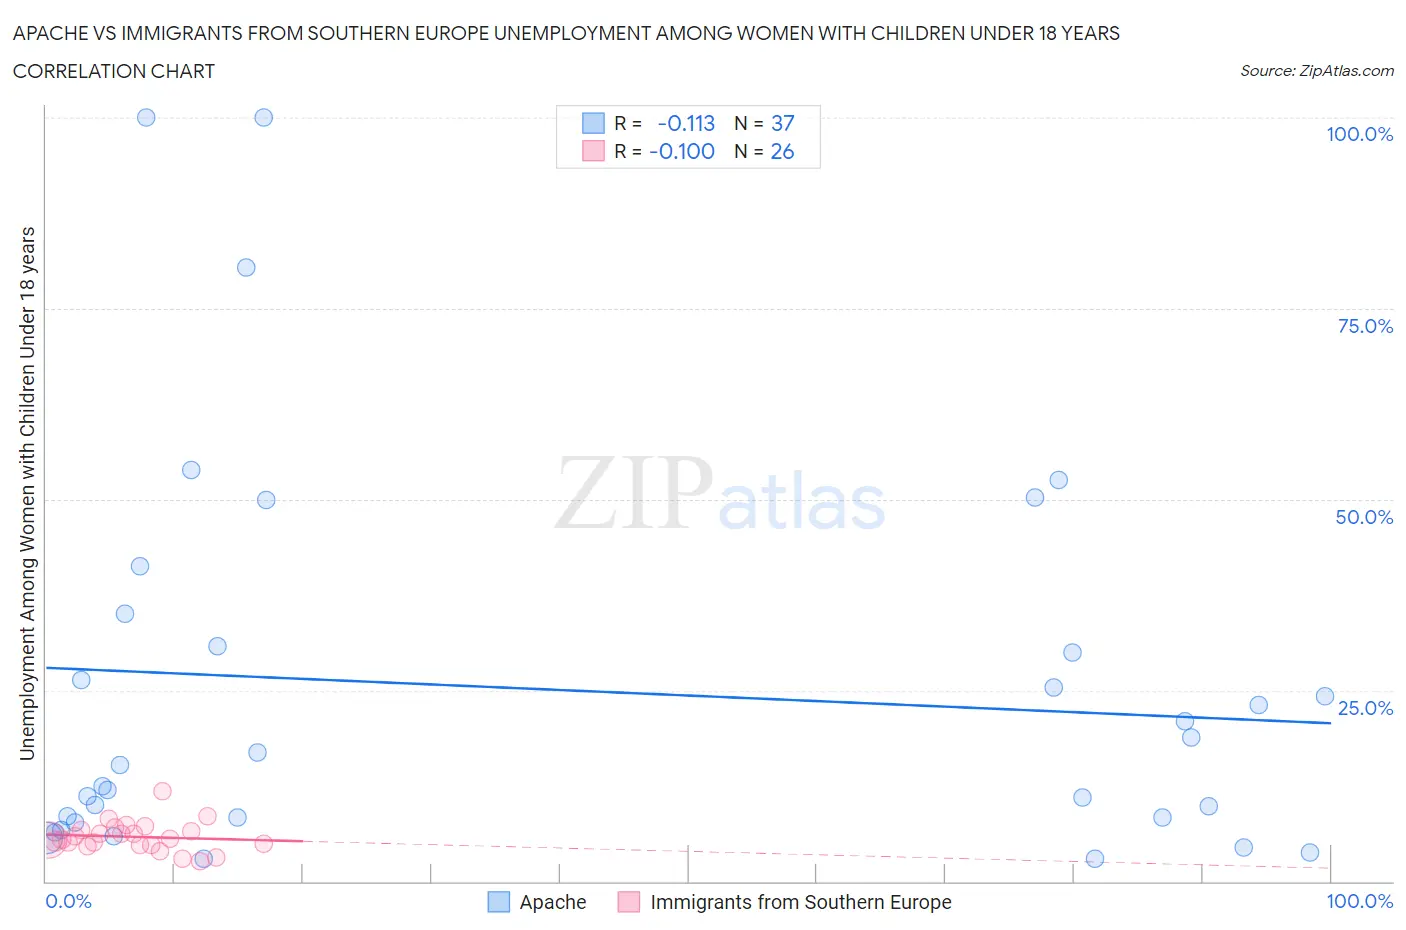
Apache vs Immigrants from Southern Europe Unemployment Among Women with Children Under 18 years Correlation Chart
The statistical analysis conducted on geographies consisting of 224,768,063 people shows a poor negative correlation between the proportion of Apache and unemployment rate among women with children under the age of 18 in the United States with a correlation coefficient (R) of -0.113 and weighted average of 7.9%. Similarly, the statistical analysis conducted on geographies consisting of 385,218,256 people shows a slight negative correlation between the proportion of Immigrants from Southern Europe and unemployment rate among women with children under the age of 18 in the United States with a correlation coefficient (R) of -0.100 and weighted average of 5.5%, a difference of 44.6%.
Unemployment Among Women with Children Under 18 years Correlation Summary
| Measurement | Apache | Immigrants from Southern Europe |
| Minimum | 2.9% | 2.6% |
| Maximum | 100.0% | 11.8% |
| Range | 97.1% | 9.2% |
| Mean | 25.2% | 5.8% |
| Median | 15.3% | 5.5% |
| Interquartile 25% (IQ1) | 8.1% | 4.7% |
| Interquartile 75% (IQ3) | 33.0% | 6.8% |
| Interquartile Range (IQR) | 24.9% | 2.0% |
| Standard Deviation (Sample) | 25.5% | 1.9% |
| Standard Deviation (Population) | 25.1% | 1.9% |
Similar Demographics by Unemployment Among Women with Children Under 18 years
Demographics Similar to Apache by Unemployment Among Women with Children Under 18 years
In terms of unemployment among women with children under 18 years, the demographic groups most similar to Apache are Sioux (7.9%, a difference of 0.30%), Cheyenne (7.8%, a difference of 0.98%), Yakama (8.1%, a difference of 1.7%), Immigrants from Yemen (8.2%, a difference of 3.4%), and Navajo (8.2%, a difference of 3.9%).
| Demographics | Rating | Rank | Unemployment Among Women with Children Under 18 years |
| Natives/Alaskans | 0.0 /100 | #328 | Tragic 7.2% |
| Blacks/African Americans | 0.0 /100 | #329 | Tragic 7.3% |
| Colville | 0.0 /100 | #330 | Tragic 7.4% |
| Hopi | 0.0 /100 | #331 | Tragic 7.4% |
| Dominicans | 0.0 /100 | #332 | Tragic 7.5% |
| Immigrants | Dominican Republic | 0.0 /100 | #333 | Tragic 7.5% |
| Cheyenne | 0.0 /100 | #334 | Tragic 7.8% |
| Apache | 0.0 /100 | #335 | Tragic 7.9% |
| Sioux | 0.0 /100 | #336 | Tragic 7.9% |
| Yakama | 0.0 /100 | #337 | Tragic 8.1% |
| Immigrants | Yemen | 0.0 /100 | #338 | Tragic 8.2% |
| Navajo | 0.0 /100 | #339 | Tragic 8.2% |
| Crow | 0.0 /100 | #340 | Tragic 8.2% |
| Tohono O'odham | 0.0 /100 | #341 | Tragic 8.9% |
| Puerto Ricans | 0.0 /100 | #342 | Tragic 9.0% |
Demographics Similar to Immigrants from Southern Europe by Unemployment Among Women with Children Under 18 years
In terms of unemployment among women with children under 18 years, the demographic groups most similar to Immigrants from Southern Europe are Syrian (5.5%, a difference of 0.010%), Immigrants from Hungary (5.5%, a difference of 0.10%), Immigrants from Sudan (5.5%, a difference of 0.15%), Costa Rican (5.5%, a difference of 0.18%), and Hawaiian (5.5%, a difference of 0.24%).
| Demographics | Rating | Rank | Unemployment Among Women with Children Under 18 years |
| Immigrants | Eastern Africa | 51.3 /100 | #173 | Average 5.4% |
| Immigrants | Uzbekistan | 50.0 /100 | #174 | Average 5.4% |
| Spanish | 49.0 /100 | #175 | Average 5.4% |
| Immigrants | Germany | 48.5 /100 | #176 | Average 5.5% |
| Hawaiians | 46.1 /100 | #177 | Average 5.5% |
| Costa Ricans | 45.2 /100 | #178 | Average 5.5% |
| Syrians | 42.8 /100 | #179 | Average 5.5% |
| Immigrants | Southern Europe | 42.7 /100 | #180 | Average 5.5% |
| Immigrants | Hungary | 41.3 /100 | #181 | Average 5.5% |
| Immigrants | Sudan | 40.6 /100 | #182 | Average 5.5% |
| Immigrants | Laos | 38.8 /100 | #183 | Fair 5.5% |
| Immigrants | Cambodia | 38.4 /100 | #184 | Fair 5.5% |
| Immigrants | Zaire | 38.1 /100 | #185 | Fair 5.5% |
| Indonesians | 36.3 /100 | #186 | Fair 5.5% |
| Malaysians | 35.7 /100 | #187 | Fair 5.5% |