Alsatian vs South African Unemployment Among Ages 45 to 54 years
COMPARE
Alsatian
South African
Unemployment Among Ages 45 to 54 years
Unemployment Among Ages 45 to 54 years Comparison
Alsatians
South Africans
4.7%
UNEMPLOYMENT AMONG AGES 45 TO 54 YEARS
1.6/ 100
METRIC RATING
237th/ 347
METRIC RANK
4.4%
UNEMPLOYMENT AMONG AGES 45 TO 54 YEARS
90.4/ 100
METRIC RATING
117th/ 347
METRIC RANK
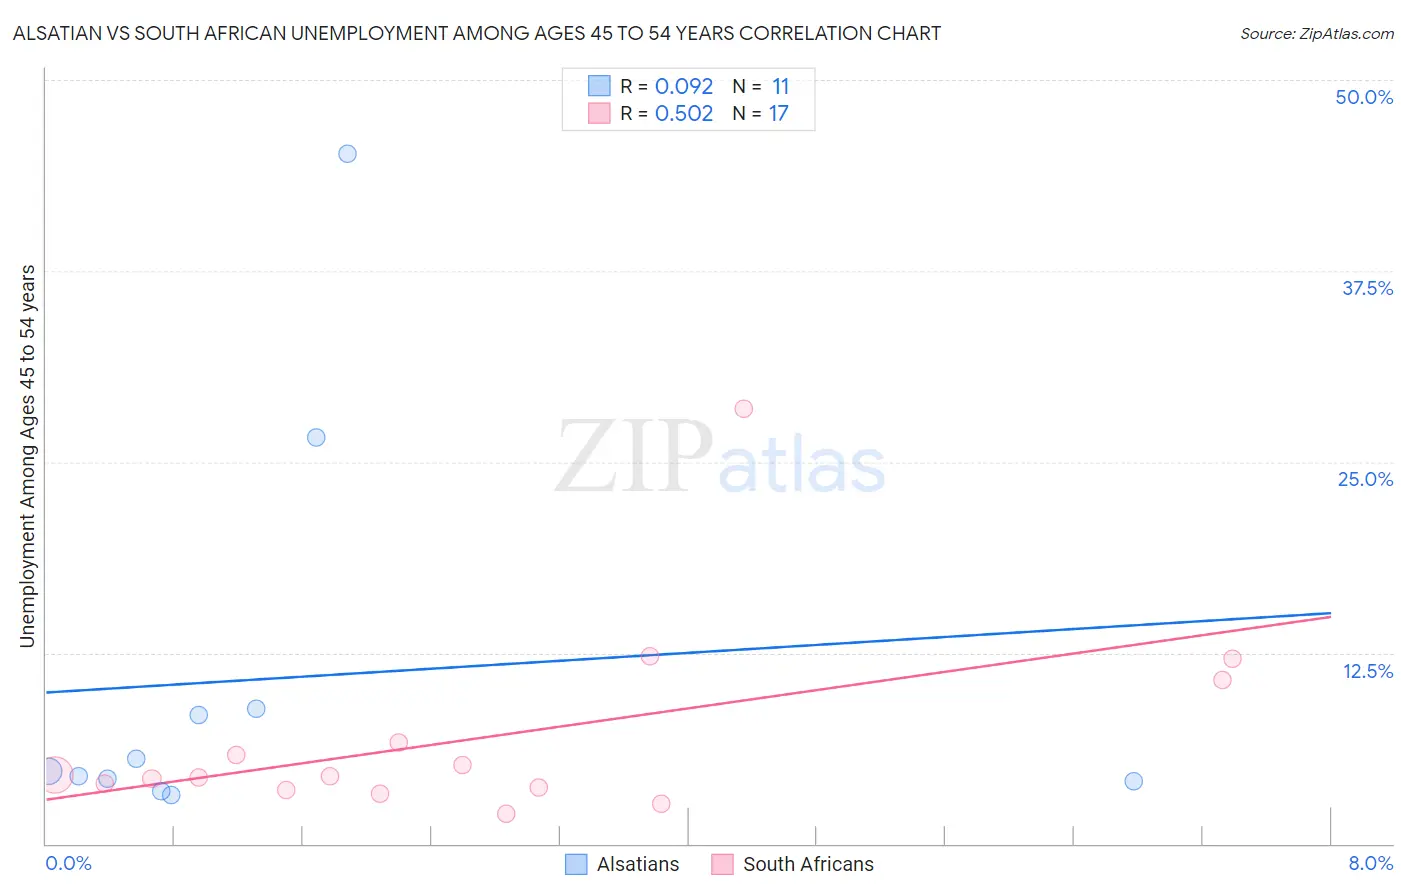
Alsatian vs South African Unemployment Among Ages 45 to 54 years Correlation Chart
The statistical analysis conducted on geographies consisting of 81,984,920 people shows a slight positive correlation between the proportion of Alsatians and unemployment rate among population between the ages 45 and 54 in the United States with a correlation coefficient (R) of 0.092 and weighted average of 4.7%. Similarly, the statistical analysis conducted on geographies consisting of 180,291,072 people shows a substantial positive correlation between the proportion of South Africans and unemployment rate among population between the ages 45 and 54 in the United States with a correlation coefficient (R) of 0.502 and weighted average of 4.4%, a difference of 7.6%.
Unemployment Among Ages 45 to 54 years Correlation Summary
| Measurement | Alsatian | South African |
| Minimum | 3.2% | 2.0% |
| Maximum | 45.2% | 28.5% |
| Range | 42.0% | 26.5% |
| Mean | 10.8% | 6.9% |
| Median | 4.8% | 4.4% |
| Interquartile 25% (IQ1) | 4.1% | 3.6% |
| Interquartile 75% (IQ3) | 8.8% | 8.7% |
| Interquartile Range (IQR) | 4.7% | 5.1% |
| Standard Deviation (Sample) | 13.2% | 6.4% |
| Standard Deviation (Population) | 12.6% | 6.2% |
Similar Demographics by Unemployment Among Ages 45 to 54 years
Demographics Similar to Alsatians by Unemployment Among Ages 45 to 54 years
In terms of unemployment among ages 45 to 54 years, the demographic groups most similar to Alsatians are Yaqui (4.7%, a difference of 0.17%), Spanish American (4.7%, a difference of 0.17%), Immigrants from Iraq (4.7%, a difference of 0.20%), Delaware (4.8%, a difference of 0.27%), and Central American (4.8%, a difference of 0.27%).
| Demographics | Rating | Rank | Unemployment Among Ages 45 to 54 years |
| Japanese | 2.8 /100 | #230 | Tragic 4.7% |
| Immigrants | Ireland | 2.7 /100 | #231 | Tragic 4.7% |
| Ottawa | 2.7 /100 | #232 | Tragic 4.7% |
| Immigrants | Immigrants | 2.6 /100 | #233 | Tragic 4.7% |
| Soviet Union | 2.6 /100 | #234 | Tragic 4.7% |
| Cree | 2.3 /100 | #235 | Tragic 4.7% |
| Tlingit-Haida | 2.3 /100 | #236 | Tragic 4.7% |
| Alsatians | 1.6 /100 | #237 | Tragic 4.7% |
| Yaqui | 1.4 /100 | #238 | Tragic 4.7% |
| Spanish Americans | 1.4 /100 | #239 | Tragic 4.7% |
| Immigrants | Iraq | 1.3 /100 | #240 | Tragic 4.7% |
| Delaware | 1.3 /100 | #241 | Tragic 4.8% |
| Central Americans | 1.3 /100 | #242 | Tragic 4.8% |
| Portuguese | 1.1 /100 | #243 | Tragic 4.8% |
| Seminole | 1.1 /100 | #244 | Tragic 4.8% |
Demographics Similar to South Africans by Unemployment Among Ages 45 to 54 years
In terms of unemployment among ages 45 to 54 years, the demographic groups most similar to South Africans are Immigrants from North Macedonia (4.4%, a difference of 0.030%), Pakistani (4.4%, a difference of 0.040%), Immigrants from Chile (4.4%, a difference of 0.060%), Immigrants from Romania (4.4%, a difference of 0.060%), and Native Hawaiian (4.4%, a difference of 0.070%).
| Demographics | Rating | Rank | Unemployment Among Ages 45 to 54 years |
| Immigrants | England | 91.3 /100 | #110 | Exceptional 4.4% |
| Immigrants | Nicaragua | 91.3 /100 | #111 | Exceptional 4.4% |
| Immigrants | Saudi Arabia | 91.1 /100 | #112 | Exceptional 4.4% |
| French Canadians | 91.0 /100 | #113 | Exceptional 4.4% |
| Immigrants | Chile | 90.9 /100 | #114 | Exceptional 4.4% |
| Pakistanis | 90.7 /100 | #115 | Exceptional 4.4% |
| Immigrants | North Macedonia | 90.6 /100 | #116 | Exceptional 4.4% |
| South Africans | 90.4 /100 | #117 | Exceptional 4.4% |
| Immigrants | Romania | 90.0 /100 | #118 | Exceptional 4.4% |
| Native Hawaiians | 90.0 /100 | #119 | Excellent 4.4% |
| Americans | 89.6 /100 | #120 | Excellent 4.4% |
| Immigrants | Oceania | 89.5 /100 | #121 | Excellent 4.4% |
| Immigrants | Kazakhstan | 89.5 /100 | #122 | Excellent 4.4% |
| Immigrants | Asia | 88.8 /100 | #123 | Excellent 4.4% |
| Spanish | 88.8 /100 | #124 | Excellent 4.4% |