Alsatian vs Immigrants from Croatia Unemployment Among Women with Children Under 18 years
COMPARE
Alsatian
Immigrants from Croatia
Unemployment Among Women with Children Under 18 years
Unemployment Among Women with Children Under 18 years Comparison
Alsatians
Immigrants from Croatia
5.8%
UNEMPLOYMENT AMONG WOMEN WITH CHILDREN UNDER 18 YEARS
2.5/ 100
METRIC RATING
236th/ 347
METRIC RANK
5.1%
UNEMPLOYMENT AMONG WOMEN WITH CHILDREN UNDER 18 YEARS
95.6/ 100
METRIC RATING
79th/ 347
METRIC RANK
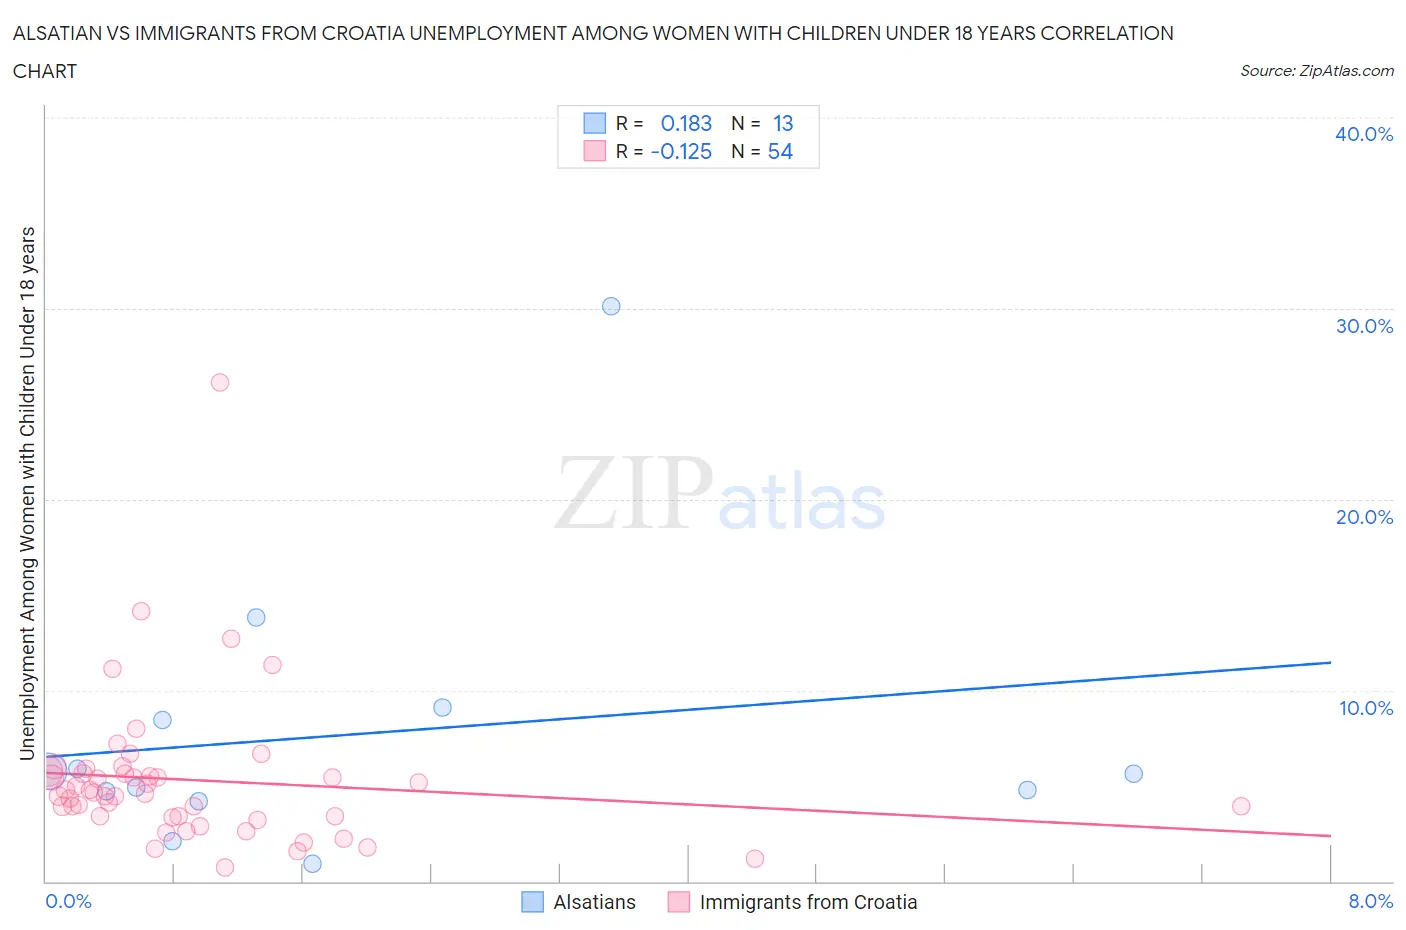
Alsatian vs Immigrants from Croatia Unemployment Among Women with Children Under 18 years Correlation Chart
The statistical analysis conducted on geographies consisting of 81,370,800 people shows a poor positive correlation between the proportion of Alsatians and unemployment rate among women with children under the age of 18 in the United States with a correlation coefficient (R) of 0.183 and weighted average of 5.8%. Similarly, the statistical analysis conducted on geographies consisting of 130,195,251 people shows a poor negative correlation between the proportion of Immigrants from Croatia and unemployment rate among women with children under the age of 18 in the United States with a correlation coefficient (R) of -0.125 and weighted average of 5.1%, a difference of 12.7%.
Unemployment Among Women with Children Under 18 years Correlation Summary
| Measurement | Alsatian | Immigrants from Croatia |
| Minimum | 0.90% | 0.70% |
| Maximum | 30.1% | 26.1% |
| Range | 29.2% | 25.4% |
| Mean | 7.7% | 5.3% |
| Median | 5.6% | 4.6% |
| Interquartile 25% (IQ1) | 4.5% | 3.4% |
| Interquartile 75% (IQ3) | 8.8% | 5.7% |
| Interquartile Range (IQR) | 4.3% | 2.3% |
| Standard Deviation (Sample) | 7.5% | 3.9% |
| Standard Deviation (Population) | 7.2% | 3.9% |
Similar Demographics by Unemployment Among Women with Children Under 18 years
Demographics Similar to Alsatians by Unemployment Among Women with Children Under 18 years
In terms of unemployment among women with children under 18 years, the demographic groups most similar to Alsatians are Immigrants from Lebanon (5.8%, a difference of 0.10%), Immigrants from Middle Africa (5.8%, a difference of 0.17%), Guamanian/Chamorro (5.8%, a difference of 0.21%), Immigrants from Somalia (5.8%, a difference of 0.28%), and Spanish American (5.8%, a difference of 0.32%).
| Demographics | Rating | Rank | Unemployment Among Women with Children Under 18 years |
| Immigrants | Panama | 3.4 /100 | #229 | Tragic 5.8% |
| Immigrants | South America | 3.2 /100 | #230 | Tragic 5.8% |
| Immigrants | Africa | 3.1 /100 | #231 | Tragic 5.8% |
| Creek | 3.1 /100 | #232 | Tragic 5.8% |
| Spanish Americans | 3.1 /100 | #233 | Tragic 5.8% |
| Guamanians/Chamorros | 2.9 /100 | #234 | Tragic 5.8% |
| Immigrants | Middle Africa | 2.8 /100 | #235 | Tragic 5.8% |
| Alsatians | 2.5 /100 | #236 | Tragic 5.8% |
| Immigrants | Lebanon | 2.4 /100 | #237 | Tragic 5.8% |
| Immigrants | Somalia | 2.2 /100 | #238 | Tragic 5.8% |
| Immigrants | Sierra Leone | 2.0 /100 | #239 | Tragic 5.8% |
| Immigrants | Immigrants | 2.0 /100 | #240 | Tragic 5.8% |
| Brazilians | 1.6 /100 | #241 | Tragic 5.8% |
| Moroccans | 1.4 /100 | #242 | Tragic 5.9% |
| Immigrants | Uruguay | 1.1 /100 | #243 | Tragic 5.9% |
Demographics Similar to Immigrants from Croatia by Unemployment Among Women with Children Under 18 years
In terms of unemployment among women with children under 18 years, the demographic groups most similar to Immigrants from Croatia are Assyrian/Chaldean/Syriac (5.1%, a difference of 0.020%), Zimbabwean (5.1%, a difference of 0.040%), Bolivian (5.1%, a difference of 0.050%), Puget Sound Salish (5.1%, a difference of 0.060%), and Immigrants from Asia (5.1%, a difference of 0.090%).
| Demographics | Rating | Rank | Unemployment Among Women with Children Under 18 years |
| Immigrants | Bolivia | 96.1 /100 | #72 | Exceptional 5.1% |
| Albanians | 95.9 /100 | #73 | Exceptional 5.1% |
| Immigrants | Northern Europe | 95.9 /100 | #74 | Exceptional 5.1% |
| Immigrants | Asia | 95.8 /100 | #75 | Exceptional 5.1% |
| Puget Sound Salish | 95.8 /100 | #76 | Exceptional 5.1% |
| Zimbabweans | 95.7 /100 | #77 | Exceptional 5.1% |
| Assyrians/Chaldeans/Syriacs | 95.7 /100 | #78 | Exceptional 5.1% |
| Immigrants | Croatia | 95.6 /100 | #79 | Exceptional 5.1% |
| Bolivians | 95.5 /100 | #80 | Exceptional 5.1% |
| Immigrants | Lithuania | 95.4 /100 | #81 | Exceptional 5.2% |
| Romanians | 95.3 /100 | #82 | Exceptional 5.2% |
| Maltese | 95.1 /100 | #83 | Exceptional 5.2% |
| Australians | 95.1 /100 | #84 | Exceptional 5.2% |
| Paraguayans | 94.8 /100 | #85 | Exceptional 5.2% |
| Immigrants | Indonesia | 94.8 /100 | #86 | Exceptional 5.2% |