Alsatian vs Immigrants from Canada Unemployment Among Ages 65 to 74 years
COMPARE
Alsatian
Immigrants from Canada
Unemployment Among Ages 65 to 74 years
Unemployment Among Ages 65 to 74 years Comparison
Alsatians
Immigrants from Canada
5.5%
UNEMPLOYMENT AMONG AGES 65 TO 74 YEARS
5.6/ 100
METRIC RATING
219th/ 347
METRIC RANK
5.3%
UNEMPLOYMENT AMONG AGES 65 TO 74 YEARS
89.0/ 100
METRIC RATING
122nd/ 347
METRIC RANK
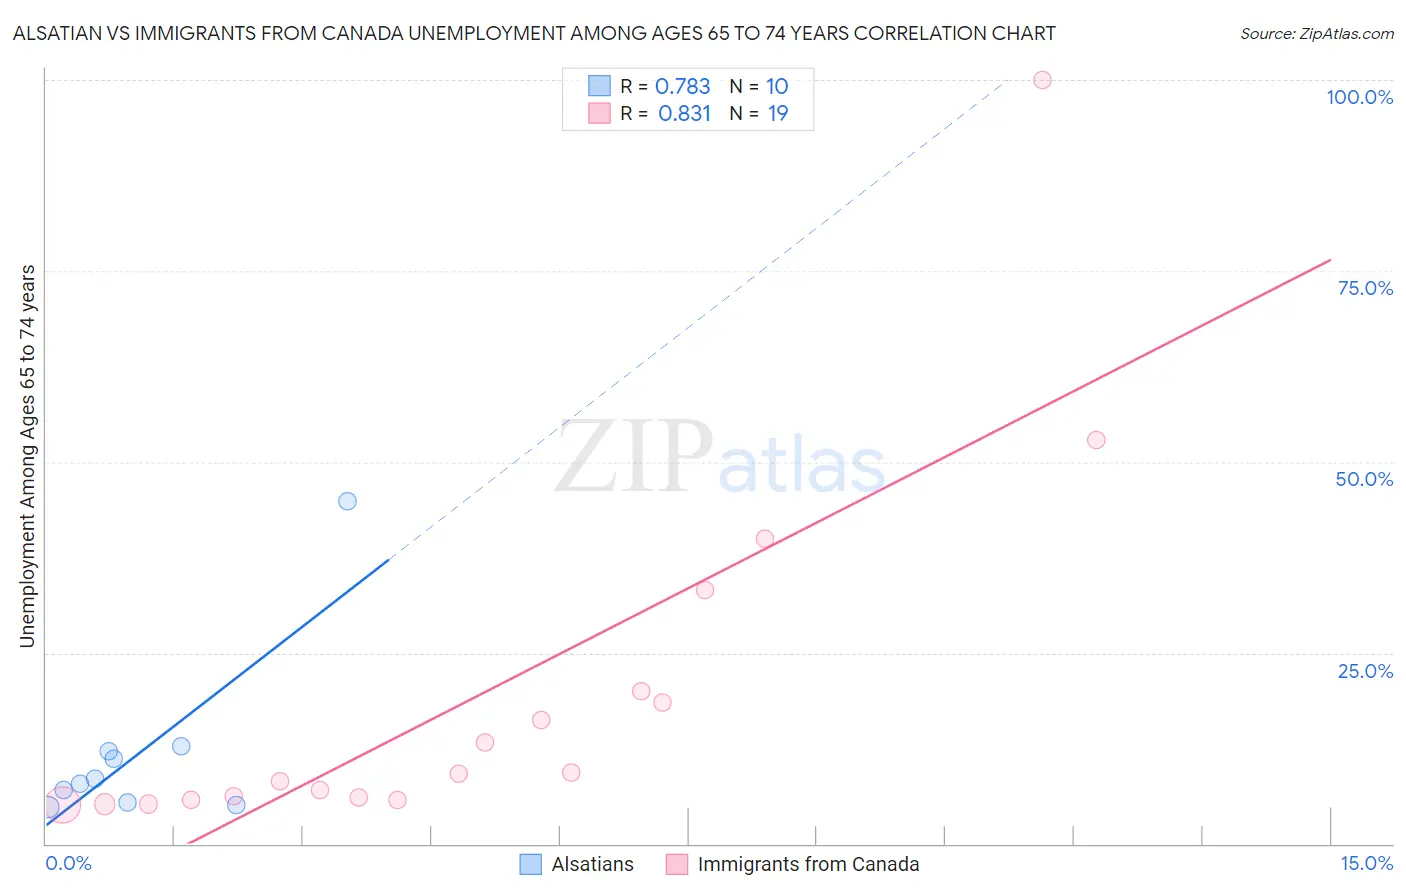
Alsatian vs Immigrants from Canada Unemployment Among Ages 65 to 74 years Correlation Chart
The statistical analysis conducted on geographies consisting of 79,300,647 people shows a strong positive correlation between the proportion of Alsatians and unemployment rate among population between the ages 65 and 74 in the United States with a correlation coefficient (R) of 0.783 and weighted average of 5.5%. Similarly, the statistical analysis conducted on geographies consisting of 390,796,891 people shows a very strong positive correlation between the proportion of Immigrants from Canada and unemployment rate among population between the ages 65 and 74 in the United States with a correlation coefficient (R) of 0.831 and weighted average of 5.3%, a difference of 4.2%.
Unemployment Among Ages 65 to 74 years Correlation Summary
| Measurement | Alsatian | Immigrants from Canada |
| Minimum | 4.8% | 5.1% |
| Maximum | 44.9% | 100.0% |
| Range | 40.1% | 94.9% |
| Mean | 11.9% | 19.3% |
| Median | 8.2% | 9.1% |
| Interquartile 25% (IQ1) | 5.4% | 5.8% |
| Interquartile 75% (IQ3) | 12.2% | 20.0% |
| Interquartile Range (IQR) | 6.8% | 14.2% |
| Standard Deviation (Sample) | 11.9% | 23.7% |
| Standard Deviation (Population) | 11.3% | 23.1% |
Similar Demographics by Unemployment Among Ages 65 to 74 years
Demographics Similar to Alsatians by Unemployment Among Ages 65 to 74 years
In terms of unemployment among ages 65 to 74 years, the demographic groups most similar to Alsatians are Samoan (5.5%, a difference of 0.020%), Blackfeet (5.5%, a difference of 0.040%), Immigrants from Syria (5.5%, a difference of 0.080%), Uruguayan (5.5%, a difference of 0.10%), and Spaniard (5.5%, a difference of 0.13%).
| Demographics | Rating | Rank | Unemployment Among Ages 65 to 74 years |
| Haitians | 7.7 /100 | #212 | Tragic 5.5% |
| Italians | 7.7 /100 | #213 | Tragic 5.5% |
| Egyptians | 7.6 /100 | #214 | Tragic 5.5% |
| Americans | 7.3 /100 | #215 | Tragic 5.5% |
| Uruguayans | 6.2 /100 | #216 | Tragic 5.5% |
| Blackfeet | 5.8 /100 | #217 | Tragic 5.5% |
| Samoans | 5.7 /100 | #218 | Tragic 5.5% |
| Alsatians | 5.6 /100 | #219 | Tragic 5.5% |
| Immigrants | Syria | 5.1 /100 | #220 | Tragic 5.5% |
| Spaniards | 4.8 /100 | #221 | Tragic 5.5% |
| Apache | 4.5 /100 | #222 | Tragic 5.5% |
| Hungarians | 4.4 /100 | #223 | Tragic 5.5% |
| Immigrants | Uruguay | 4.2 /100 | #224 | Tragic 5.5% |
| Immigrants | Trinidad and Tobago | 4.1 /100 | #225 | Tragic 5.5% |
| Hondurans | 3.7 /100 | #226 | Tragic 5.5% |
Demographics Similar to Immigrants from Canada by Unemployment Among Ages 65 to 74 years
In terms of unemployment among ages 65 to 74 years, the demographic groups most similar to Immigrants from Canada are Immigrants from Australia (5.3%, a difference of 0.010%), Czechoslovakian (5.3%, a difference of 0.040%), Immigrants from Fiji (5.3%, a difference of 0.080%), Immigrants from Switzerland (5.3%, a difference of 0.080%), and Immigrants from Belarus (5.3%, a difference of 0.10%).
| Demographics | Rating | Rank | Unemployment Among Ages 65 to 74 years |
| Immigrants | Turkey | 90.8 /100 | #115 | Exceptional 5.3% |
| Australians | 90.4 /100 | #116 | Exceptional 5.3% |
| Immigrants | Korea | 90.2 /100 | #117 | Exceptional 5.3% |
| Immigrants | Belarus | 90.1 /100 | #118 | Exceptional 5.3% |
| Immigrants | Fiji | 89.9 /100 | #119 | Excellent 5.3% |
| Immigrants | Switzerland | 89.9 /100 | #120 | Excellent 5.3% |
| Immigrants | Australia | 89.1 /100 | #121 | Excellent 5.3% |
| Immigrants | Canada | 89.0 /100 | #122 | Excellent 5.3% |
| Czechoslovakians | 88.6 /100 | #123 | Excellent 5.3% |
| Immigrants | Ukraine | 87.5 /100 | #124 | Excellent 5.3% |
| Pakistanis | 87.5 /100 | #125 | Excellent 5.3% |
| Immigrants | South Eastern Asia | 87.2 /100 | #126 | Excellent 5.3% |
| Immigrants | North America | 86.7 /100 | #127 | Excellent 5.3% |
| Immigrants | Hong Kong | 86.5 /100 | #128 | Excellent 5.3% |
| Immigrants | England | 86.2 /100 | #129 | Excellent 5.3% |