Alsatian vs Immigrants from Belarus Unemployment Among Youth under 25 years
COMPARE
Alsatian
Immigrants from Belarus
Unemployment Among Youth under 25 years
Unemployment Among Youth under 25 years Comparison
Alsatians
Immigrants from Belarus
11.9%
UNEMPLOYMENT AMONG YOUTH UNDER 25 YEARS
6.1/ 100
METRIC RATING
220th/ 347
METRIC RANK
12.1%
UNEMPLOYMENT AMONG YOUTH UNDER 25 YEARS
1.6/ 100
METRIC RATING
232nd/ 347
METRIC RANK
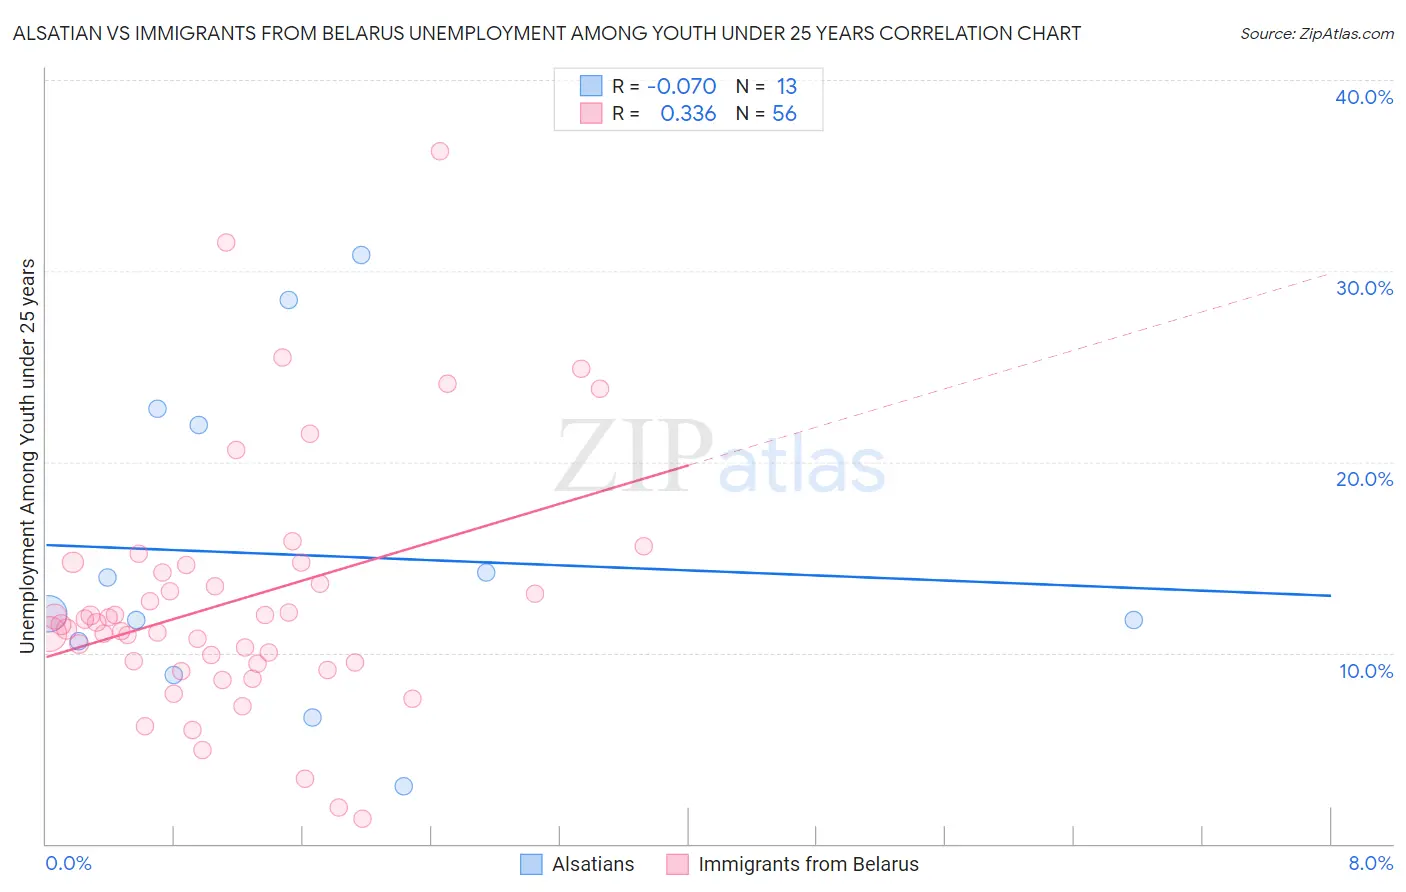
Alsatian vs Immigrants from Belarus Unemployment Among Youth under 25 years Correlation Chart
The statistical analysis conducted on geographies consisting of 82,312,882 people shows a slight negative correlation between the proportion of Alsatians and unemployment rate among youth under the age of 25 in the United States with a correlation coefficient (R) of -0.070 and weighted average of 11.9%. Similarly, the statistical analysis conducted on geographies consisting of 149,553,401 people shows a mild positive correlation between the proportion of Immigrants from Belarus and unemployment rate among youth under the age of 25 in the United States with a correlation coefficient (R) of 0.336 and weighted average of 12.1%, a difference of 1.3%.
Unemployment Among Youth under 25 years Correlation Summary
| Measurement | Alsatian | Immigrants from Belarus |
| Minimum | 3.0% | 1.3% |
| Maximum | 30.8% | 36.3% |
| Range | 27.8% | 35.0% |
| Mean | 15.1% | 12.7% |
| Median | 12.0% | 11.5% |
| Interquartile 25% (IQ1) | 9.7% | 9.5% |
| Interquartile 75% (IQ3) | 22.4% | 14.4% |
| Interquartile Range (IQR) | 12.6% | 4.9% |
| Standard Deviation (Sample) | 8.4% | 6.6% |
| Standard Deviation (Population) | 8.1% | 6.5% |
Demographics Similar to Alsatians and Immigrants from Belarus by Unemployment Among Youth under 25 years
In terms of unemployment among youth under 25 years, the demographic groups most similar to Alsatians are Nonimmigrants (11.9%, a difference of 0.020%), Immigrants from Middle Africa (11.9%, a difference of 0.13%), Yaqui (11.9%, a difference of 0.14%), Guamanian/Chamorro (11.9%, a difference of 0.15%), and Immigrants from Portugal (12.0%, a difference of 0.23%). Similarly, the demographic groups most similar to Immigrants from Belarus are South American Indian (12.1%, a difference of 0.020%), Immigrants from South America (12.1%, a difference of 0.070%), Guatemalan (12.1%, a difference of 0.16%), Choctaw (12.1%, a difference of 0.17%), and Immigrants from Guatemala (12.1%, a difference of 0.18%).
| Demographics | Rating | Rank | Unemployment Among Youth under 25 years |
| Guamanians/Chamorros | 7.0 /100 | #216 | Tragic 11.9% |
| Yaqui | 6.9 /100 | #217 | Tragic 11.9% |
| Immigrants | Middle Africa | 6.8 /100 | #218 | Tragic 11.9% |
| Immigrants | Nonimmigrants | 6.2 /100 | #219 | Tragic 11.9% |
| Alsatians | 6.1 /100 | #220 | Tragic 11.9% |
| Immigrants | Portugal | 4.9 /100 | #221 | Tragic 12.0% |
| Israelis | 4.1 /100 | #222 | Tragic 12.0% |
| Immigrants | Ireland | 3.5 /100 | #223 | Tragic 12.0% |
| Hawaiians | 3.5 /100 | #224 | Tragic 12.0% |
| Immigrants | Ukraine | 3.0 /100 | #225 | Tragic 12.0% |
| Immigrants | Israel | 2.6 /100 | #226 | Tragic 12.0% |
| Immigrants | Iran | 2.6 /100 | #227 | Tragic 12.0% |
| Immigrants | Fiji | 2.1 /100 | #228 | Tragic 12.1% |
| Moroccans | 2.1 /100 | #229 | Tragic 12.1% |
| Choctaw | 1.9 /100 | #230 | Tragic 12.1% |
| Immigrants | South America | 1.8 /100 | #231 | Tragic 12.1% |
| Immigrants | Belarus | 1.6 /100 | #232 | Tragic 12.1% |
| South American Indians | 1.6 /100 | #233 | Tragic 12.1% |
| Guatemalans | 1.4 /100 | #234 | Tragic 12.1% |
| Immigrants | Guatemala | 1.4 /100 | #235 | Tragic 12.1% |
| Immigrants | Immigrants | 1.3 /100 | #236 | Tragic 12.1% |