Aleut vs Senegalese Unemployment Among Ages 55 to 59 years
COMPARE
Aleut
Senegalese
Unemployment Among Ages 55 to 59 years
Unemployment Among Ages 55 to 59 years Comparison
Aleuts
Senegalese
6.4%
UNEMPLOYMENT AMONG AGES 55 TO 59 YEARS
0.0/ 100
METRIC RATING
332nd/ 347
METRIC RANK
5.1%
UNEMPLOYMENT AMONG AGES 55 TO 59 YEARS
0.3/ 100
METRIC RATING
256th/ 347
METRIC RANK
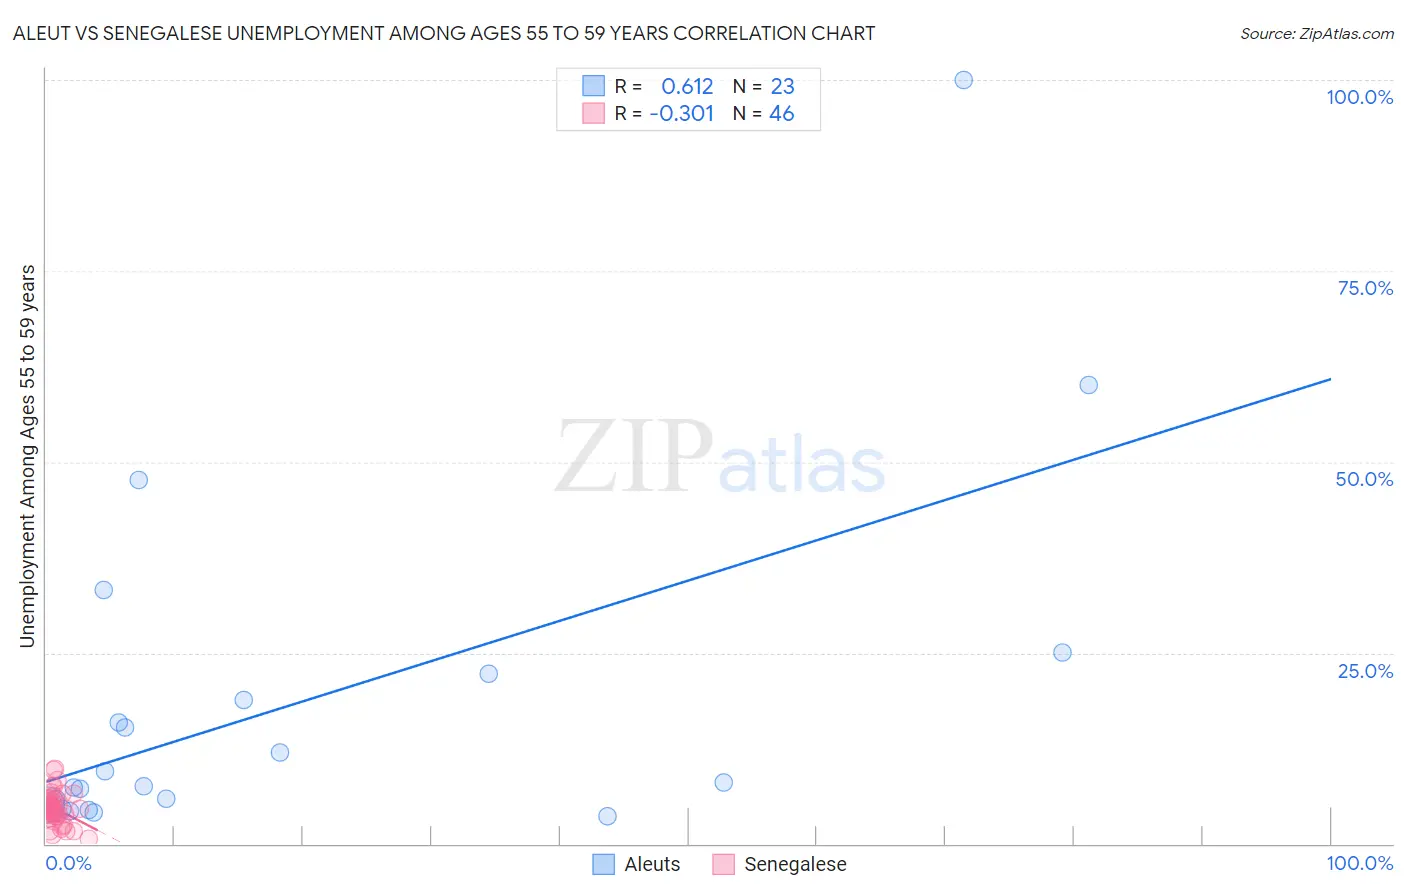
Aleut vs Senegalese Unemployment Among Ages 55 to 59 years Correlation Chart
The statistical analysis conducted on geographies consisting of 60,136,595 people shows a significant positive correlation between the proportion of Aleuts and unemployment rate among population between the ages 55 and 59 in the United States with a correlation coefficient (R) of 0.612 and weighted average of 6.4%. Similarly, the statistical analysis conducted on geographies consisting of 76,756,988 people shows a mild negative correlation between the proportion of Senegalese and unemployment rate among population between the ages 55 and 59 in the United States with a correlation coefficient (R) of -0.301 and weighted average of 5.1%, a difference of 26.0%.
Unemployment Among Ages 55 to 59 years Correlation Summary
| Measurement | Aleut | Senegalese |
| Minimum | 3.6% | 0.60% |
| Maximum | 100.0% | 9.9% |
| Range | 96.4% | 9.3% |
| Mean | 18.6% | 4.6% |
| Median | 8.0% | 4.6% |
| Interquartile 25% (IQ1) | 5.1% | 3.6% |
| Interquartile 75% (IQ3) | 22.2% | 5.3% |
| Interquartile Range (IQR) | 17.1% | 1.6% |
| Standard Deviation (Sample) | 23.0% | 2.0% |
| Standard Deviation (Population) | 22.5% | 2.0% |
Similar Demographics by Unemployment Among Ages 55 to 59 years
Demographics Similar to Aleuts by Unemployment Among Ages 55 to 59 years
In terms of unemployment among ages 55 to 59 years, the demographic groups most similar to Aleuts are Immigrants from Dominican Republic (6.3%, a difference of 2.4%), Pima (6.6%, a difference of 2.8%), Alaska Native (6.2%, a difference of 3.1%), Dominican (6.2%, a difference of 3.6%), and Pueblo (6.7%, a difference of 4.1%).
| Demographics | Rating | Rank | Unemployment Among Ages 55 to 59 years |
| Immigrants | Armenia | 0.0 /100 | #325 | Tragic 6.0% |
| Natives/Alaskans | 0.0 /100 | #326 | Tragic 6.0% |
| Arapaho | 0.0 /100 | #327 | Tragic 6.1% |
| Yuman | 0.0 /100 | #328 | Tragic 6.1% |
| Dominicans | 0.0 /100 | #329 | Tragic 6.2% |
| Alaska Natives | 0.0 /100 | #330 | Tragic 6.2% |
| Immigrants | Dominican Republic | 0.0 /100 | #331 | Tragic 6.3% |
| Aleuts | 0.0 /100 | #332 | Tragic 6.4% |
| Pima | 0.0 /100 | #333 | Tragic 6.6% |
| Pueblo | 0.0 /100 | #334 | Tragic 6.7% |
| Colville | 0.0 /100 | #335 | Tragic 6.7% |
| Navajo | 0.0 /100 | #336 | Tragic 6.7% |
| Paiute | 0.0 /100 | #337 | Tragic 6.8% |
| Immigrants | Yemen | 0.0 /100 | #338 | Tragic 6.9% |
| Puerto Ricans | 0.0 /100 | #339 | Tragic 7.0% |
Demographics Similar to Senegalese by Unemployment Among Ages 55 to 59 years
In terms of unemployment among ages 55 to 59 years, the demographic groups most similar to Senegalese are Blackfeet (5.1%, a difference of 0.11%), Seminole (5.1%, a difference of 0.18%), Paraguayan (5.1%, a difference of 0.21%), U.S. Virgin Islander (5.1%, a difference of 0.25%), and Portuguese (5.1%, a difference of 0.27%).
| Demographics | Rating | Rank | Unemployment Among Ages 55 to 59 years |
| Comanche | 0.4 /100 | #249 | Tragic 5.1% |
| Cheyenne | 0.4 /100 | #250 | Tragic 5.1% |
| Portuguese | 0.3 /100 | #251 | Tragic 5.1% |
| U.S. Virgin Islanders | 0.3 /100 | #252 | Tragic 5.1% |
| Paraguayans | 0.3 /100 | #253 | Tragic 5.1% |
| Seminole | 0.3 /100 | #254 | Tragic 5.1% |
| Blackfeet | 0.3 /100 | #255 | Tragic 5.1% |
| Senegalese | 0.3 /100 | #256 | Tragic 5.1% |
| Central Americans | 0.2 /100 | #257 | Tragic 5.1% |
| Salvadorans | 0.2 /100 | #258 | Tragic 5.1% |
| Immigrants | West Indies | 0.2 /100 | #259 | Tragic 5.1% |
| Immigrants | Western Africa | 0.2 /100 | #260 | Tragic 5.1% |
| Africans | 0.1 /100 | #261 | Tragic 5.1% |
| Immigrants | El Salvador | 0.1 /100 | #262 | Tragic 5.1% |
| Immigrants | Sierra Leone | 0.1 /100 | #263 | Tragic 5.2% |