Aleut vs Egyptian Unemployment Among Ages 20 to 24 years

COMPARE

Aleut
Race
Ancestry
AfghanAfricanAlaska NativeAlaskan AthabascanAlbanianAleutAlsatianAmericanApacheArabArapahoArgentineanArmenianAssyrian/Chaldean/SyriacAustralianAustrianBahamianBangladeshiBarbadianBasqueBelgianBelizeanBermudanBhutaneseBlackfeetBolivianBrazilianBritishBritish West IndianBulgarianBurmeseCajunCambodianCanadianCape VerdeanCarpatho RusynCelticCentral AmericanCentral American IndianCherokeeCheyenneChickasawChileanChineseChippewaChoctawColombianColvilleComancheCosta RicanCreeCreekCroatianCrowCubanCypriotCzechCzechoslovakianDanishDelawareDominicanDutchDutch West IndianEastern EuropeanEcuadorianEnglishEstonianEthiopianEuropeanFijianFilipinoFinnishFrenchFrench American IndianFrench CanadianGermanGerman RussianGhanaianGreekGuamanian/ChamorroGuatemalanGuyaneseHaitianHmongHonduranHopiHoumaHungarianIcelanderIndian (Asian)IndonesianInupiatIranianIraqiIrishIroquoisIsraeliItalianJamaicanJapaneseJordanianKenyanKiowaKoreanLaotianLatvianLebaneseLiberianLithuanianLumbeeLuxembourgerMacedonianMalaysianMalteseMarshalleseMenomineeMexicanMexican American IndianMongolianMoroccanNative HawaiianNavajoNepaleseNew ZealanderNicaraguanNigerianNorthern EuropeanNorwegianOkinawanOsageOttawaPaiutePakistaniPalestinianPanamanianParaguayanPennsylvania GermanPeruvianPimaPolishPortuguesePotawatomiPuebloPuerto RicanPuget Sound SalishRomanianRussianSalvadoranSamoanScandinavianScotch-IrishScottishSeminoleSenegaleseSerbianShoshoneSierra LeoneanSiouxSlavicSlovakSloveneSomaliSouth AfricanSouth AmericanSouth American IndianSoviet UnionSpaniardSpanishSpanish AmericanSpanish American IndianSri LankanSubsaharan AfricanSudaneseSwedishSwissSyrianTaiwaneseThaiTlingit-HaidaTohono O'OdhamTonganTrinidadian and TobagonianTsimshianTurkishU.S. Virgin IslanderUgandanUkrainianUruguayanUteVenezuelanVietnameseWelshWest IndianYakamaYaquiYugoslavianYumanYup'ikZimbabwean
Immigration
NonimmigrantsImmigrantsAfghanistanAfricaAlbaniaArgentinaArmeniaAsiaAustraliaAustriaBahamasBangladeshBarbadosBelarusBelgiumBelizeBoliviaBosnia and HerzegovinaBrazilBulgariaBurma/MyanmarCabo VerdeCambodiaCameroonCanadaCaribbeanCentral AmericaChileChinaColombiaCongoCosta RicaCroatiaCubaCzechoslovakiaDenmarkDominicaDominican RepublicEastern AfricaEastern AsiaEastern EuropeEcuadorEgyptEl SalvadorEnglandEritreaEthiopiaEuropeFijiFranceGermanyGhanaGreeceGrenadaGuatemalaGuyanaHaitiHondurasHong KongHungaryIndiaIndonesiaIranIraqIrelandIsraelItalyJamaicaJapanJordanKazakhstanKenyaKoreaKuwaitLaosLatin AmericaLatviaLebanonLiberiaLithuaniaMalaysiaMexicoMicronesiaMiddle AfricaMoldovaMoroccoNepalNetherlandsNicaraguaNigeriaNorth AmericaNorth MacedoniaNorthern AfricaNorthern EuropeNorwayOceaniaPakistanPanamaPeruPhilippinesPolandPortugalRomaniaRussiaSaudi ArabiaScotlandSenegalSerbiaSierra LeoneSingaporeSomaliaSouth AfricaSouth AmericaSouth Central AsiaSouth Eastern AsiaSouthern EuropeSpainSri LankaSt. Vincent and the GrenadinesSudanSwedenSwitzerlandSyriaTaiwanThailandTrinidad and TobagoTurkeyUgandaUkraineUruguayUzbekistanVenezuelaVietnamWest IndiesWestern AfricaWestern AsiaWestern EuropeYemenZaireZimbabweAzores
Egyptian
Race
Ancestry
AfghanAfricanAlaska NativeAlaskan AthabascanAlbanianAlsatianAmericanApacheArabArapahoArgentineanArmenianAssyrian/Chaldean/SyriacAustralianAustrianBahamianBangladeshiBarbadianBasqueBelgianBelizeanBermudanBhutaneseBlackfeetBolivianBrazilianBritishBritish West IndianBulgarianBurmeseCajunCambodianCanadianCape VerdeanCarpatho RusynCelticCentral AmericanCentral American IndianCherokeeCheyenneChickasawChileanChineseChippewaChoctawColombianColvilleComancheCosta RicanCreeCreekCroatianCrowCubanCypriotCzechCzechoslovakianDanishDelawareDominicanDutchDutch West IndianEastern EuropeanEcuadorianEgyptianEnglishEstonianEthiopianEuropeanFijianFilipinoFinnishFrenchFrench American IndianFrench CanadianGermanGerman RussianGhanaianGreekGuamanian/ChamorroGuatemalanGuyaneseHaitianHmongHonduranHopiHoumaHungarianIcelanderIndian (Asian)IndonesianInupiatIranianIraqiIrishIroquoisIsraeliItalianJamaicanJapaneseJordanianKenyanKiowaKoreanLaotianLatvianLebaneseLiberianLithuanianLumbeeLuxembourgerMacedonianMalaysianMalteseMarshalleseMenomineeMexicanMexican American IndianMongolianMoroccanNative HawaiianNavajoNepaleseNew ZealanderNicaraguanNigerianNorthern EuropeanNorwegianOkinawanOsageOttawaPaiutePakistaniPalestinianPanamanianParaguayanPennsylvania GermanPeruvianPimaPolishPortuguesePotawatomiPuebloPuerto RicanPuget Sound SalishRomanianRussianSalvadoranSamoanScandinavianScotch-IrishScottishSeminoleSenegaleseSerbianShoshoneSierra LeoneanSiouxSlavicSlovakSloveneSomaliSouth AfricanSouth AmericanSouth American IndianSoviet UnionSpaniardSpanishSpanish AmericanSpanish American IndianSri LankanSubsaharan AfricanSudaneseSwedishSwissSyrianTaiwaneseThaiTlingit-HaidaTohono O'OdhamTonganTrinidadian and TobagonianTsimshianTurkishU.S. Virgin IslanderUgandanUkrainianUruguayanUteVenezuelanVietnameseWelshWest IndianYakamaYaquiYugoslavianYumanYup'ikZimbabwean
Immigration
NonimmigrantsImmigrantsAfghanistanAfricaAlbaniaArgentinaArmeniaAsiaAustraliaAustriaBahamasBangladeshBarbadosBelarusBelgiumBelizeBoliviaBosnia and HerzegovinaBrazilBulgariaBurma/MyanmarCabo VerdeCambodiaCameroonCanadaCaribbeanCentral AmericaChileChinaColombiaCongoCosta RicaCroatiaCubaCzechoslovakiaDenmarkDominicaDominican RepublicEastern AfricaEastern AsiaEastern EuropeEcuadorEgyptEl SalvadorEnglandEritreaEthiopiaEuropeFijiFranceGermanyGhanaGreeceGrenadaGuatemalaGuyanaHaitiHondurasHong KongHungaryIndiaIndonesiaIranIraqIrelandIsraelItalyJamaicaJapanJordanKazakhstanKenyaKoreaKuwaitLaosLatin AmericaLatviaLebanonLiberiaLithuaniaMalaysiaMexicoMicronesiaMiddle AfricaMoldovaMoroccoNepalNetherlandsNicaraguaNigeriaNorth AmericaNorth MacedoniaNorthern AfricaNorthern EuropeNorwayOceaniaPakistanPanamaPeruPhilippinesPolandPortugalRomaniaRussiaSaudi ArabiaScotlandSenegalSerbiaSierra LeoneSingaporeSomaliaSouth AfricaSouth AmericaSouth Central AsiaSouth Eastern AsiaSouthern EuropeSpainSri LankaSt. Vincent and the GrenadinesSudanSwedenSwitzerlandSyriaTaiwanThailandTrinidad and TobagoTurkeyUgandaUkraineUruguayUzbekistanVenezuelaVietnamWest IndiesWestern AfricaWestern AsiaWestern EuropeYemenZaireZimbabweAzores
Unemployment Among Ages 20 to 24 years
Income
Poverty
Unemployment
Labor Participation
Family Structure
Vehicle Availability
Education Level
Disability

Unemployment Among Ages 20 to 24 years Comparison

Aleuts

Egyptians

Tragic
Fair
13.8%
UNEMPLOYMENT AMONG AGES 20 TO 24 YEARS
0.0/ 100
METRIC RATING
331st/ 347
METRIC RANK
10.4%
UNEMPLOYMENT AMONG AGES 20 TO 24 YEARS
24.5/ 100
METRIC RATING
195th/ 347
METRIC RANK

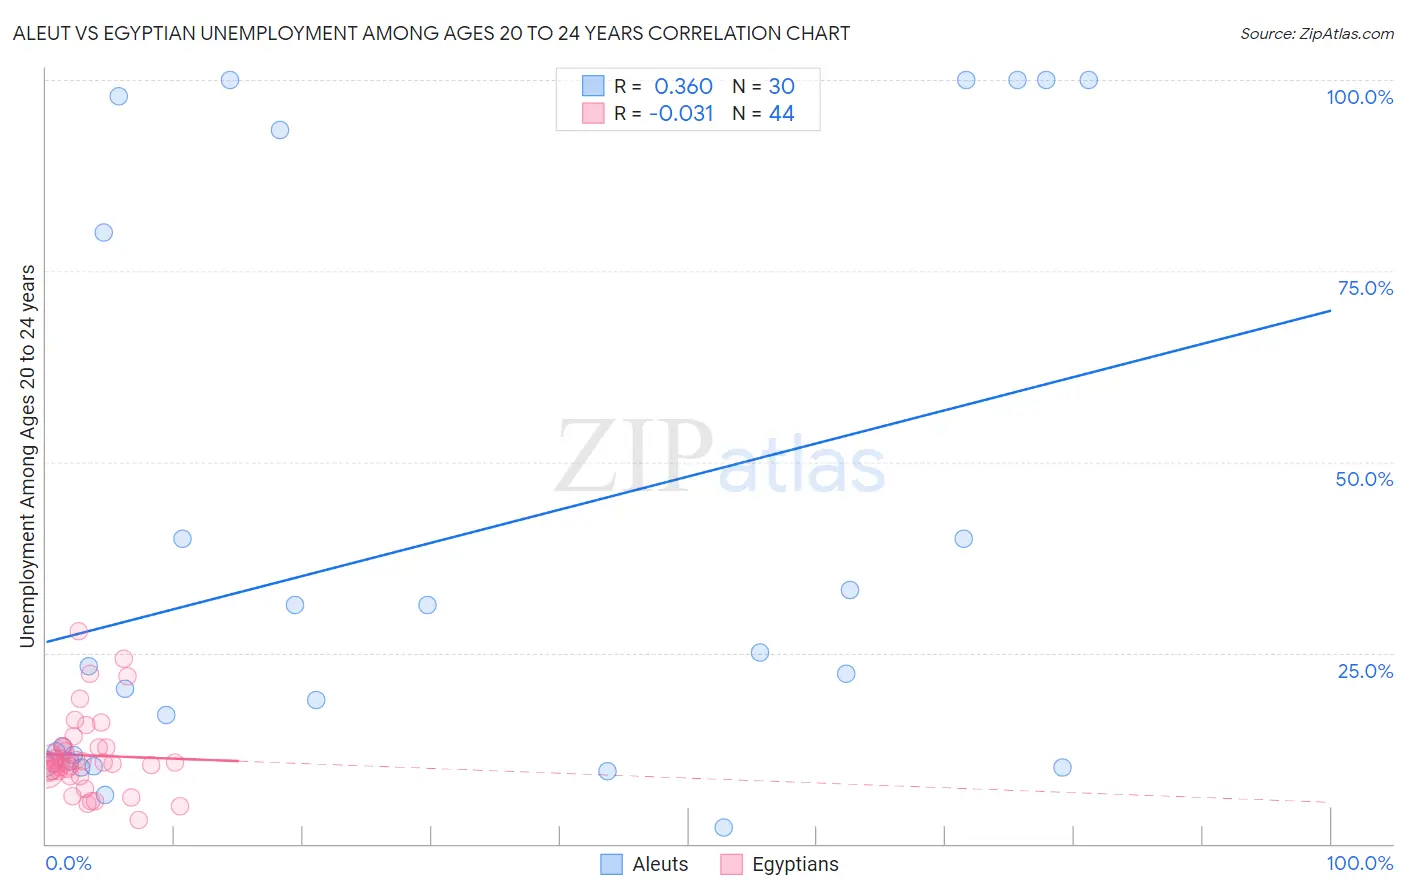
Aleut vs Egyptian Unemployment Among Ages 20 to 24 years Correlation Chart

The statistical analysis conducted on geographies consisting of 61,151,302 people shows a mild positive correlation between the proportion of Aleuts and unemployment rate among population between the ages 20 and 24 in the United States with a correlation coefficient (R) of 0.360 and weighted average of 13.8%. Similarly, the statistical analysis conducted on geographies consisting of 272,756,089 people shows no correlation between the proportion of Egyptians and unemployment rate among population between the ages 20 and 24 in the United States with a correlation coefficient (R) of -0.031 and weighted average of 10.4%, a difference of 32.9%.
Aleut vs Egyptian Unemployment Among Ages 20 to 24 years

Unemployment Among Ages 20 to 24 years Correlation Summary

MeasurementAleutEgyptian
Minimum2.2%3.1%
Maximum100.0%27.9%
Range97.8%24.8%
Mean39.3%11.6%
Median22.7%10.6%
Interquartile 25% (IQ1)10.8%9.6%
Interquartile 75% (IQ3)80.0%12.6%
Interquartile Range (IQR)69.2%3.1%
Standard Deviation (Sample)36.4%5.1%
Standard Deviation (Population)35.8%5.1%

Similar Demographics by Unemployment Among Ages 20 to 24 years

Demographics Similar to Aleuts by Unemployment Among Ages 20 to 24 years

In terms of unemployment among ages 20 to 24 years, the demographic groups most similar to Aleuts are Immigrants from Grenada (13.8%, a difference of 0.060%), Arapaho (13.8%, a difference of 0.27%), Dominican (13.8%, a difference of 0.35%), Immigrants from Guyana (13.9%, a difference of 0.58%), and British West Indian (13.7%, a difference of 0.91%).
DemographicsRating | RankUnemployment Among Ages 20 to 24 years
Alaska Natives
0.0
/100
|
#324
Tragic
13.2%
Pueblo
0.0
/100
|
#325
Tragic
13.2%
Immigrants | Barbados
0.0
/100
|
#326
Tragic
13.5%
Immigrants | Dominican Republic
0.0
/100
|
#327
Tragic
13.6%
British West Indians
0.0
/100
|
#328
Tragic
13.7%
Dominicans
0.0
/100
|
#329
Tragic
13.8%
Arapaho
0.0
/100
|
#330
Tragic
13.8%
Aleuts
0.0
/100
|
#331
Tragic
13.8%
Immigrants | Grenada
0.0
/100
|
#332
Tragic
13.8%
Immigrants | Guyana
0.0
/100
|
#333
Tragic
13.9%
Guyanese
0.0
/100
|
#334
Tragic
14.0%
Sioux
0.0
/100
|
#335
Tragic
14.2%
Pima
0.0
/100
|
#336
Tragic
14.2%
Paiute
0.0
/100
|
#337
Tragic
14.3%
Immigrants | St. Vincent and the Grenadines
0.0
/100
|
#338
Tragic
14.3%

Demographics Similar to Egyptians by Unemployment Among Ages 20 to 24 years

In terms of unemployment among ages 20 to 24 years, the demographic groups most similar to Egyptians are Immigrants from Philippines (10.4%, a difference of 0.020%), Immigrants from Italy (10.4%, a difference of 0.030%), Immigrants from Portugal (10.4%, a difference of 0.040%), Ugandan (10.4%, a difference of 0.060%), and Immigrants from Eastern Europe (10.4%, a difference of 0.070%).
DemographicsRating | RankUnemployment Among Ages 20 to 24 years
Immigrants | Russia
34.6
/100
|
#188
Fair
10.4%
Hawaiians
33.9
/100
|
#189
Fair
10.4%
Immigrants | China
32.6
/100
|
#190
Fair
10.4%
Immigrants | Eastern Europe
25.8
/100
|
#191
Fair
10.4%
Ugandans
25.7
/100
|
#192
Fair
10.4%
Immigrants | Portugal
25.3
/100
|
#193
Fair
10.4%
Immigrants | Italy
25.0
/100
|
#194
Fair
10.4%
Egyptians
24.5
/100
|
#195
Fair
10.4%
Immigrants | Philippines
24.1
/100
|
#196
Fair
10.4%
Immigrants | Denmark
22.8
/100
|
#197
Fair
10.4%
Colombians
22.3
/100
|
#198
Fair
10.4%
Portuguese
21.8
/100
|
#199
Fair
10.4%
Russians
21.2
/100
|
#200
Fair
10.4%
Immigrants | Peru
21.2
/100
|
#201
Fair
10.4%
Immigrants | Middle Africa
20.9
/100
|
#202
Fair
10.4%