Albanian vs Lebanese Unemployment Among Youth under 25 years
COMPARE
Albanian
Lebanese
Unemployment Among Youth under 25 years
Unemployment Among Youth under 25 years Comparison
Albanians
Lebanese
12.1%
UNEMPLOYMENT AMONG YOUTH UNDER 25 YEARS
1.2/ 100
METRIC RATING
238th/ 347
METRIC RANK
11.4%
UNEMPLOYMENT AMONG YOUTH UNDER 25 YEARS
83.1/ 100
METRIC RATING
133rd/ 347
METRIC RANK
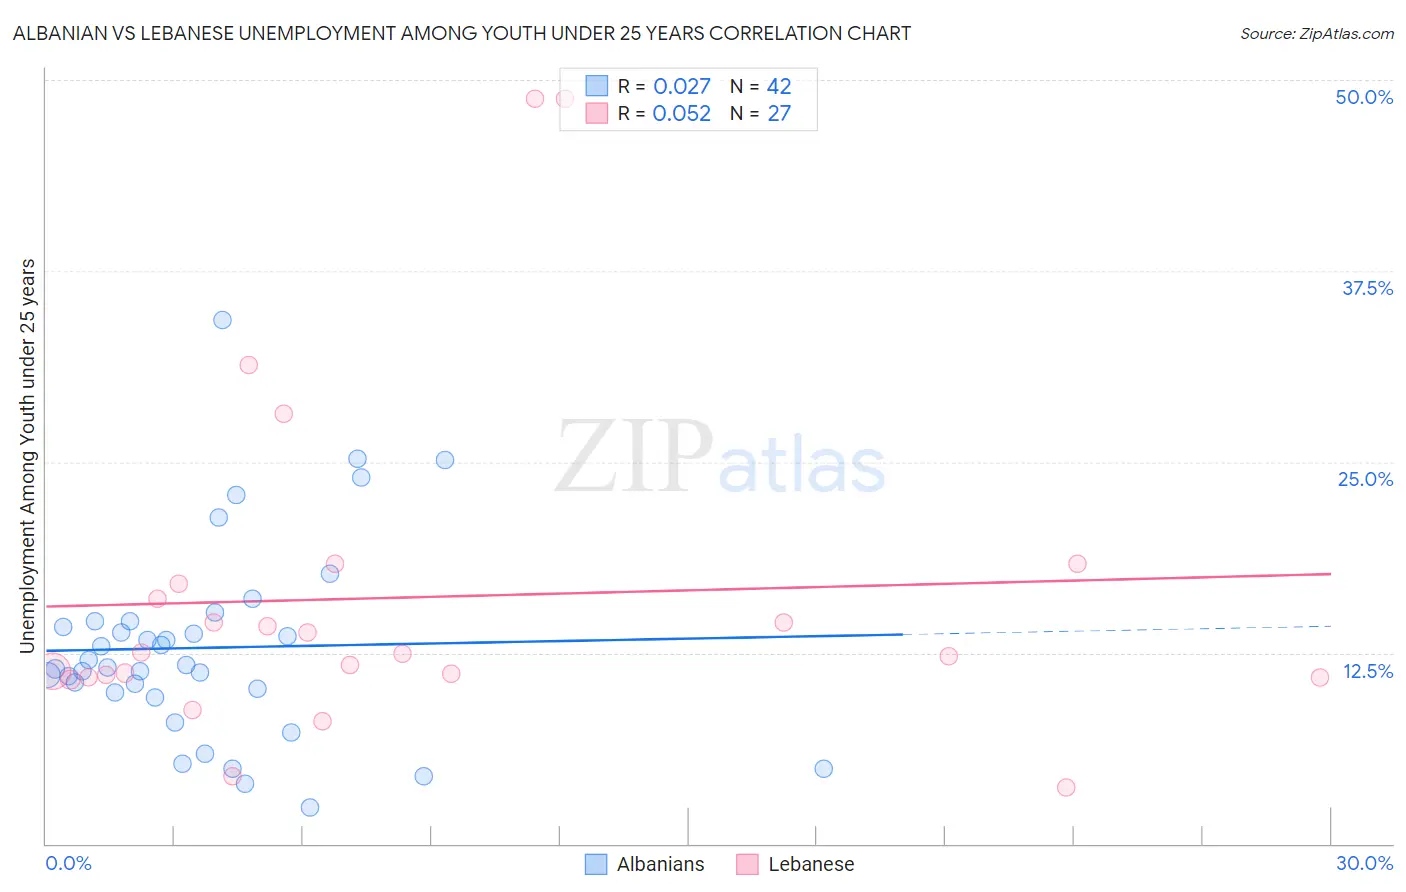
Albanian vs Lebanese Unemployment Among Youth under 25 years Correlation Chart
The statistical analysis conducted on geographies consisting of 191,841,654 people shows no correlation between the proportion of Albanians and unemployment rate among youth under the age of 25 in the United States with a correlation coefficient (R) of 0.027 and weighted average of 12.1%. Similarly, the statistical analysis conducted on geographies consisting of 396,360,095 people shows a slight positive correlation between the proportion of Lebanese and unemployment rate among youth under the age of 25 in the United States with a correlation coefficient (R) of 0.052 and weighted average of 11.4%, a difference of 6.3%.
Unemployment Among Youth under 25 years Correlation Summary
| Measurement | Albanian | Lebanese |
| Minimum | 2.4% | 3.7% |
| Maximum | 34.3% | 48.8% |
| Range | 31.9% | 45.1% |
| Mean | 12.8% | 16.1% |
| Median | 11.6% | 12.5% |
| Interquartile 25% (IQ1) | 9.9% | 10.9% |
| Interquartile 75% (IQ3) | 14.5% | 17.0% |
| Interquartile Range (IQR) | 4.6% | 6.1% |
| Standard Deviation (Sample) | 6.5% | 11.1% |
| Standard Deviation (Population) | 6.4% | 10.9% |
Similar Demographics by Unemployment Among Youth under 25 years
Demographics Similar to Albanians by Unemployment Among Youth under 25 years
In terms of unemployment among youth under 25 years, the demographic groups most similar to Albanians are Native Hawaiian (12.1%, a difference of 0.060%), Immigrants from Africa (12.1%, a difference of 0.060%), Dutch West Indian (12.1%, a difference of 0.080%), Immigrants (12.1%, a difference of 0.090%), and Immigrants from Albania (12.1%, a difference of 0.10%).
| Demographics | Rating | Rank | Unemployment Among Youth under 25 years |
| Immigrants | South America | 1.8 /100 | #231 | Tragic 12.1% |
| Immigrants | Belarus | 1.6 /100 | #232 | Tragic 12.1% |
| South American Indians | 1.6 /100 | #233 | Tragic 12.1% |
| Guatemalans | 1.4 /100 | #234 | Tragic 12.1% |
| Immigrants | Guatemala | 1.4 /100 | #235 | Tragic 12.1% |
| Immigrants | Immigrants | 1.3 /100 | #236 | Tragic 12.1% |
| Native Hawaiians | 1.3 /100 | #237 | Tragic 12.1% |
| Albanians | 1.2 /100 | #238 | Tragic 12.1% |
| Immigrants | Africa | 1.1 /100 | #239 | Tragic 12.1% |
| Dutch West Indians | 1.1 /100 | #240 | Tragic 12.1% |
| Immigrants | Albania | 1.1 /100 | #241 | Tragic 12.1% |
| Immigrants | Western Asia | 0.8 /100 | #242 | Tragic 12.2% |
| Immigrants | Azores | 0.6 /100 | #243 | Tragic 12.2% |
| Alaskan Athabascans | 0.6 /100 | #244 | Tragic 12.2% |
| Spanish Americans | 0.6 /100 | #245 | Tragic 12.2% |
Demographics Similar to Lebanese by Unemployment Among Youth under 25 years
In terms of unemployment among youth under 25 years, the demographic groups most similar to Lebanese are Ethiopian (11.4%, a difference of 0.010%), Immigrants from Spain (11.4%, a difference of 0.12%), Immigrants from Chile (11.4%, a difference of 0.19%), Immigrants from Oceania (11.4%, a difference of 0.20%), and Hungarian (11.4%, a difference of 0.21%).
| Demographics | Rating | Rank | Unemployment Among Youth under 25 years |
| Canadians | 86.6 /100 | #126 | Excellent 11.4% |
| Greeks | 86.2 /100 | #127 | Excellent 11.4% |
| Immigrants | Hungary | 86.0 /100 | #128 | Excellent 11.4% |
| Turks | 85.8 /100 | #129 | Excellent 11.4% |
| Hungarians | 85.7 /100 | #130 | Excellent 11.4% |
| Immigrants | Spain | 84.6 /100 | #131 | Excellent 11.4% |
| Ethiopians | 83.2 /100 | #132 | Excellent 11.4% |
| Lebanese | 83.1 /100 | #133 | Excellent 11.4% |
| Immigrants | Chile | 80.4 /100 | #134 | Excellent 11.4% |
| Immigrants | Oceania | 80.2 /100 | #135 | Excellent 11.4% |
| Romanians | 80.1 /100 | #136 | Excellent 11.4% |
| Asians | 79.7 /100 | #137 | Good 11.4% |
| Immigrants | England | 78.1 /100 | #138 | Good 11.5% |
| Immigrants | Indonesia | 77.6 /100 | #139 | Good 11.5% |
| Immigrants | Belgium | 77.5 /100 | #140 | Good 11.5% |