Albanian vs Immigrants from Austria Unemployment Among Ages 30 to 34 years
COMPARE
Albanian
Immigrants from Austria
Unemployment Among Ages 30 to 34 years
Unemployment Among Ages 30 to 34 years Comparison
Albanians
Immigrants from Austria
5.4%
UNEMPLOYMENT AMONG AGES 30 TO 34 YEARS
63.7/ 100
METRIC RATING
157th/ 347
METRIC RANK
5.5%
UNEMPLOYMENT AMONG AGES 30 TO 34 YEARS
51.3/ 100
METRIC RATING
172nd/ 347
METRIC RANK
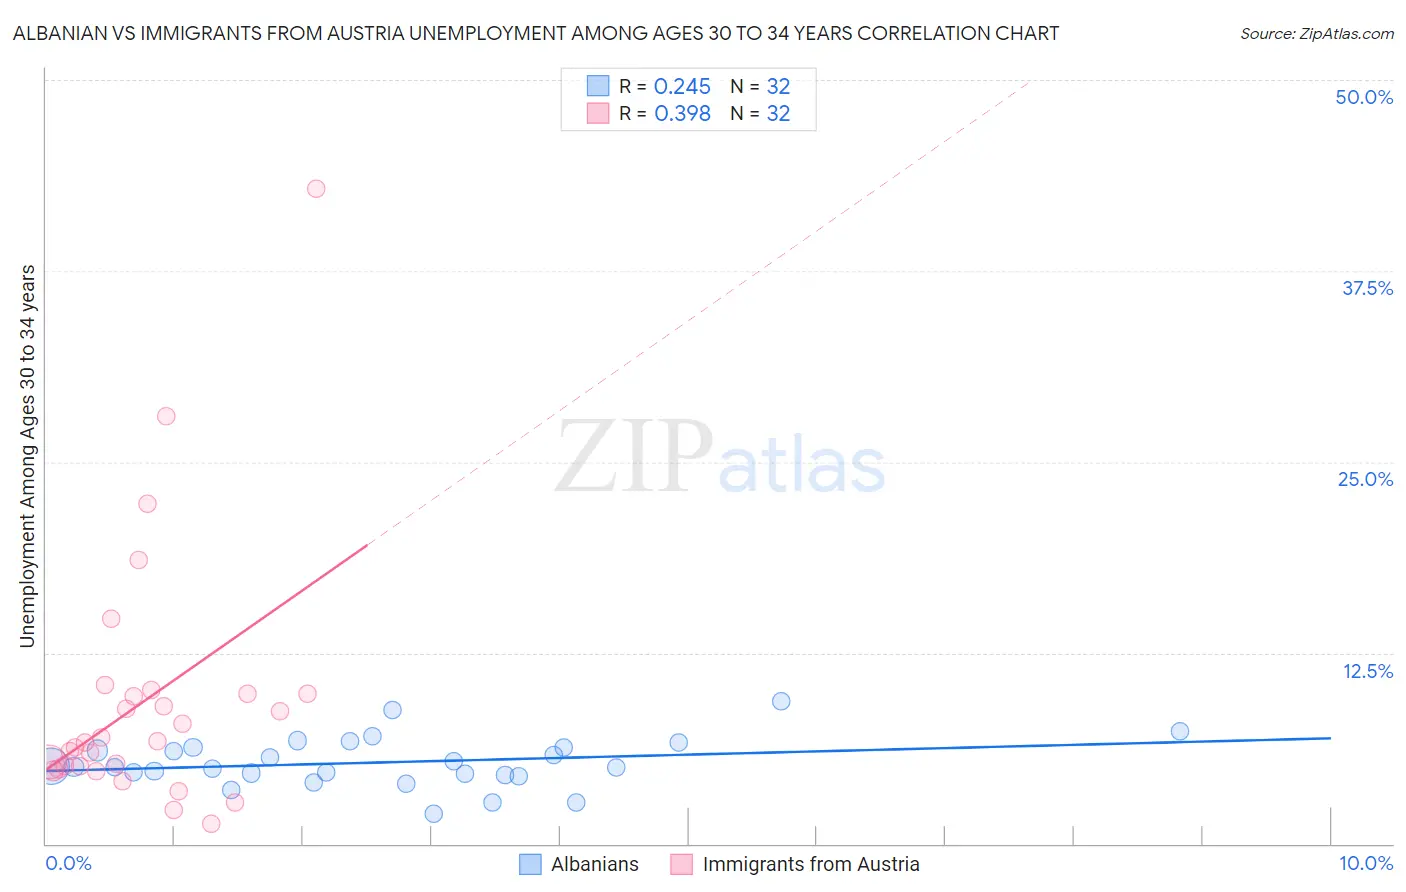
Albanian vs Immigrants from Austria Unemployment Among Ages 30 to 34 years Correlation Chart
The statistical analysis conducted on geographies consisting of 186,030,176 people shows a weak positive correlation between the proportion of Albanians and unemployment rate among population between the ages 30 and 34 in the United States with a correlation coefficient (R) of 0.245 and weighted average of 5.4%. Similarly, the statistical analysis conducted on geographies consisting of 162,627,970 people shows a mild positive correlation between the proportion of Immigrants from Austria and unemployment rate among population between the ages 30 and 34 in the United States with a correlation coefficient (R) of 0.398 and weighted average of 5.5%, a difference of 0.89%.
Unemployment Among Ages 30 to 34 years Correlation Summary
| Measurement | Albanian | Immigrants from Austria |
| Minimum | 2.0% | 1.3% |
| Maximum | 9.4% | 42.9% |
| Range | 7.4% | 41.6% |
| Mean | 5.3% | 9.3% |
| Median | 5.0% | 6.7% |
| Interquartile 25% (IQ1) | 4.6% | 5.0% |
| Interquartile 75% (IQ3) | 6.3% | 9.8% |
| Interquartile Range (IQR) | 1.8% | 4.8% |
| Standard Deviation (Sample) | 1.6% | 8.4% |
| Standard Deviation (Population) | 1.6% | 8.2% |
Demographics Similar to Albanians and Immigrants from Austria by Unemployment Among Ages 30 to 34 years
In terms of unemployment among ages 30 to 34 years, the demographic groups most similar to Albanians are Czechoslovakian (5.4%, a difference of 0.010%), Immigrants from Belarus (5.4%, a difference of 0.070%), Immigrants from Hungary (5.4%, a difference of 0.19%), Immigrants from Croatia (5.4%, a difference of 0.20%), and South African (5.4%, a difference of 0.22%). Similarly, the demographic groups most similar to Immigrants from Austria are Scottish (5.5%, a difference of 0.030%), Peruvian (5.5%, a difference of 0.080%), Dutch (5.5%, a difference of 0.090%), Immigrants from Laos (5.5%, a difference of 0.090%), and Immigrants from Israel (5.4%, a difference of 0.11%).
| Demographics | Rating | Rank | Unemployment Among Ages 30 to 34 years |
| South Africans | 66.5 /100 | #154 | Good 5.4% |
| Immigrants | Hungary | 66.1 /100 | #155 | Good 5.4% |
| Czechoslovakians | 63.7 /100 | #156 | Good 5.4% |
| Albanians | 63.7 /100 | #157 | Good 5.4% |
| Immigrants | Belarus | 62.7 /100 | #158 | Good 5.4% |
| Immigrants | Croatia | 61.0 /100 | #159 | Good 5.4% |
| Immigrants | Scotland | 59.3 /100 | #160 | Average 5.4% |
| Austrians | 59.0 /100 | #161 | Average 5.4% |
| Brazilians | 58.2 /100 | #162 | Average 5.4% |
| Arabs | 57.7 /100 | #163 | Average 5.4% |
| Basques | 57.3 /100 | #164 | Average 5.4% |
| Welsh | 56.3 /100 | #165 | Average 5.4% |
| Immigrants | Thailand | 55.6 /100 | #166 | Average 5.4% |
| English | 54.8 /100 | #167 | Average 5.4% |
| South Americans | 52.9 /100 | #168 | Average 5.4% |
| Immigrants | Israel | 52.9 /100 | #169 | Average 5.4% |
| Dutch | 52.6 /100 | #170 | Average 5.5% |
| Scottish | 51.8 /100 | #171 | Average 5.5% |
| Immigrants | Austria | 51.3 /100 | #172 | Average 5.5% |
| Peruvians | 50.2 /100 | #173 | Average 5.5% |
| Immigrants | Laos | 50.0 /100 | #174 | Average 5.5% |