Albanian vs Cajun Unemployment Among Ages 25 to 29 years
COMPARE
Albanian
Cajun
Unemployment Among Ages 25 to 29 years
Unemployment Among Ages 25 to 29 years Comparison
Albanians
Cajuns
6.6%
UNEMPLOYMENT AMONG AGES 25 TO 29 YEARS
53.5/ 100
METRIC RATING
170th/ 347
METRIC RANK
8.0%
UNEMPLOYMENT AMONG AGES 25 TO 29 YEARS
0.0/ 100
METRIC RATING
304th/ 347
METRIC RANK
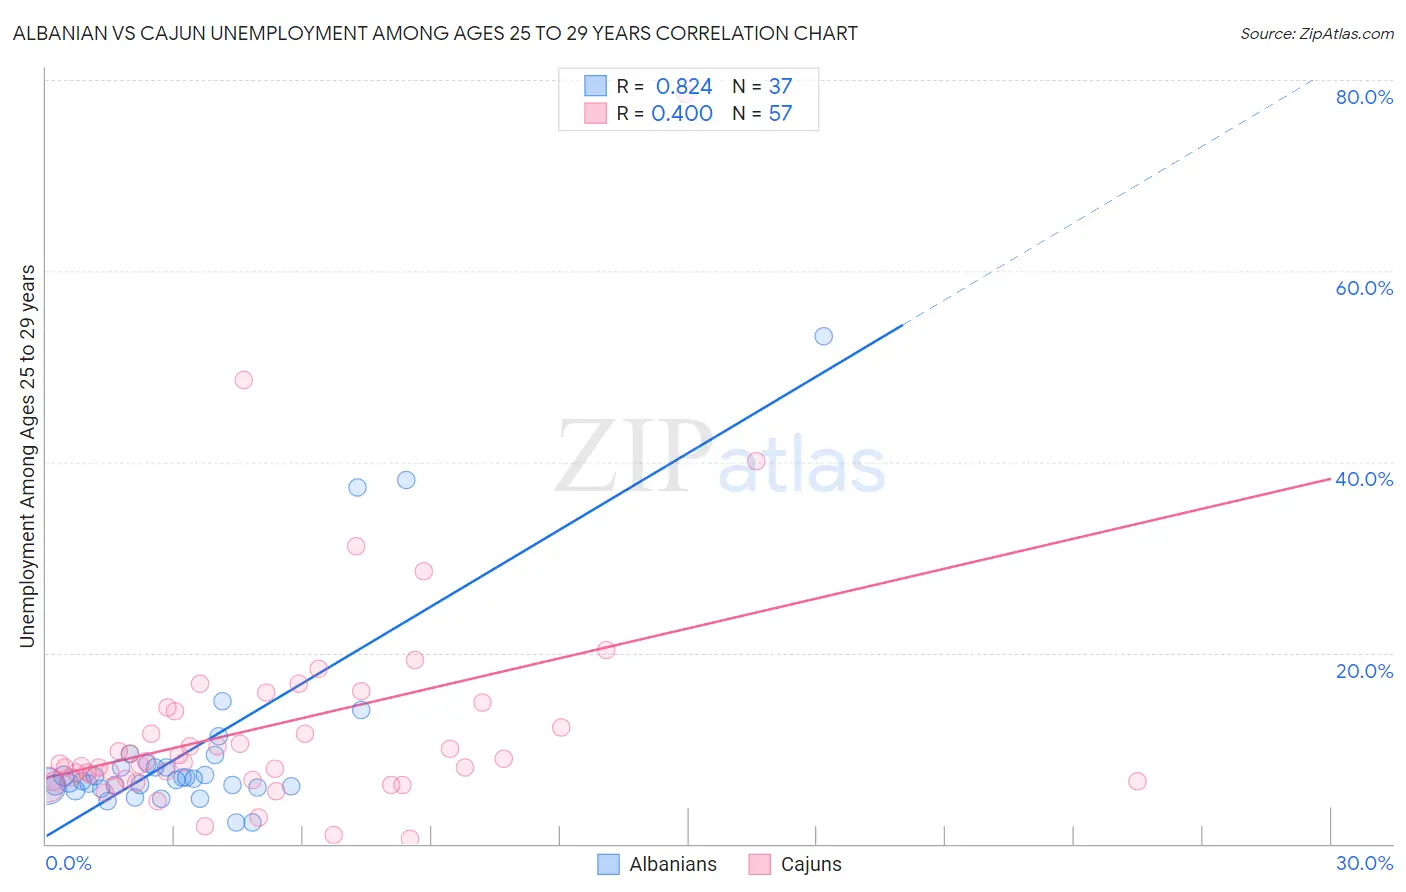
Albanian vs Cajun Unemployment Among Ages 25 to 29 years Correlation Chart
The statistical analysis conducted on geographies consisting of 187,118,297 people shows a very strong positive correlation between the proportion of Albanians and unemployment rate among population between the ages 25 and 29 in the United States with a correlation coefficient (R) of 0.824 and weighted average of 6.6%. Similarly, the statistical analysis conducted on geographies consisting of 144,936,199 people shows a mild positive correlation between the proportion of Cajuns and unemployment rate among population between the ages 25 and 29 in the United States with a correlation coefficient (R) of 0.400 and weighted average of 8.0%, a difference of 20.7%.
Unemployment Among Ages 25 to 29 years Correlation Summary
| Measurement | Albanian | Cajun |
| Minimum | 2.2% | 0.50% |
| Maximum | 53.2% | 78.6% |
| Range | 51.0% | 78.1% |
| Mean | 9.9% | 12.3% |
| Median | 6.6% | 8.4% |
| Interquartile 25% (IQ1) | 5.9% | 6.6% |
| Interquartile 75% (IQ3) | 8.2% | 14.0% |
| Interquartile Range (IQR) | 2.2% | 7.4% |
| Standard Deviation (Sample) | 10.5% | 12.4% |
| Standard Deviation (Population) | 10.3% | 12.3% |
Similar Demographics by Unemployment Among Ages 25 to 29 years
Demographics Similar to Albanians by Unemployment Among Ages 25 to 29 years
In terms of unemployment among ages 25 to 29 years, the demographic groups most similar to Albanians are South American (6.6%, a difference of 0.060%), Immigrants from Cambodia (6.6%, a difference of 0.060%), Estonian (6.6%, a difference of 0.080%), Immigrants from Canada (6.6%, a difference of 0.090%), and Bangladeshi (6.6%, a difference of 0.12%).
| Demographics | Rating | Rank | Unemployment Among Ages 25 to 29 years |
| Immigrants | Middle Africa | 59.4 /100 | #163 | Average 6.6% |
| Greeks | 58.5 /100 | #164 | Average 6.6% |
| English | 58.0 /100 | #165 | Average 6.6% |
| Immigrants | Northern Europe | 57.3 /100 | #166 | Average 6.6% |
| Immigrants | Canada | 55.0 /100 | #167 | Average 6.6% |
| Estonians | 54.8 /100 | #168 | Average 6.6% |
| South Americans | 54.5 /100 | #169 | Average 6.6% |
| Albanians | 53.5 /100 | #170 | Average 6.6% |
| Immigrants | Cambodia | 52.6 /100 | #171 | Average 6.6% |
| Bangladeshis | 51.6 /100 | #172 | Average 6.6% |
| Russians | 51.3 /100 | #173 | Average 6.6% |
| Immigrants | North America | 50.0 /100 | #174 | Average 6.6% |
| Immigrants | South Eastern Asia | 49.1 /100 | #175 | Average 6.7% |
| Osage | 48.1 /100 | #176 | Average 6.7% |
| Immigrants | Israel | 47.8 /100 | #177 | Average 6.7% |
Demographics Similar to Cajuns by Unemployment Among Ages 25 to 29 years
In terms of unemployment among ages 25 to 29 years, the demographic groups most similar to Cajuns are Immigrants from Yemen (8.0%, a difference of 0.22%), Tsimshian (8.0%, a difference of 0.26%), Haitian (8.0%, a difference of 0.34%), Immigrants from Barbados (8.0%, a difference of 0.50%), and Immigrants from Jamaica (8.1%, a difference of 0.92%).
| Demographics | Rating | Rank | Unemployment Among Ages 25 to 29 years |
| Blackfeet | 0.0 /100 | #297 | Tragic 7.9% |
| Immigrants | Trinidad and Tobago | 0.0 /100 | #298 | Tragic 7.9% |
| Barbadians | 0.0 /100 | #299 | Tragic 7.9% |
| Central American Indians | 0.0 /100 | #300 | Tragic 7.9% |
| West Indians | 0.0 /100 | #301 | Tragic 7.9% |
| Jamaicans | 0.0 /100 | #302 | Tragic 7.9% |
| Immigrants | Yemen | 0.0 /100 | #303 | Tragic 8.0% |
| Cajuns | 0.0 /100 | #304 | Tragic 8.0% |
| Tsimshian | 0.0 /100 | #305 | Tragic 8.0% |
| Haitians | 0.0 /100 | #306 | Tragic 8.0% |
| Immigrants | Barbados | 0.0 /100 | #307 | Tragic 8.0% |
| Immigrants | Jamaica | 0.0 /100 | #308 | Tragic 8.1% |
| Immigrants | Haiti | 0.0 /100 | #309 | Tragic 8.1% |
| U.S. Virgin Islanders | 0.0 /100 | #310 | Tragic 8.1% |
| Immigrants | Azores | 0.0 /100 | #311 | Tragic 8.1% |