Alaskan Athabascan vs Canadian Unemployment Among Ages 30 to 34 years
COMPARE
Alaskan Athabascan
Canadian
Unemployment Among Ages 30 to 34 years
Unemployment Among Ages 30 to 34 years Comparison
Alaskan Athabascans
Canadians
7.0%
UNEMPLOYMENT AMONG AGES 30 TO 34 YEARS
0.0/ 100
METRIC RATING
311th/ 347
METRIC RANK
5.5%
UNEMPLOYMENT AMONG AGES 30 TO 34 YEARS
38.2/ 100
METRIC RATING
186th/ 347
METRIC RANK
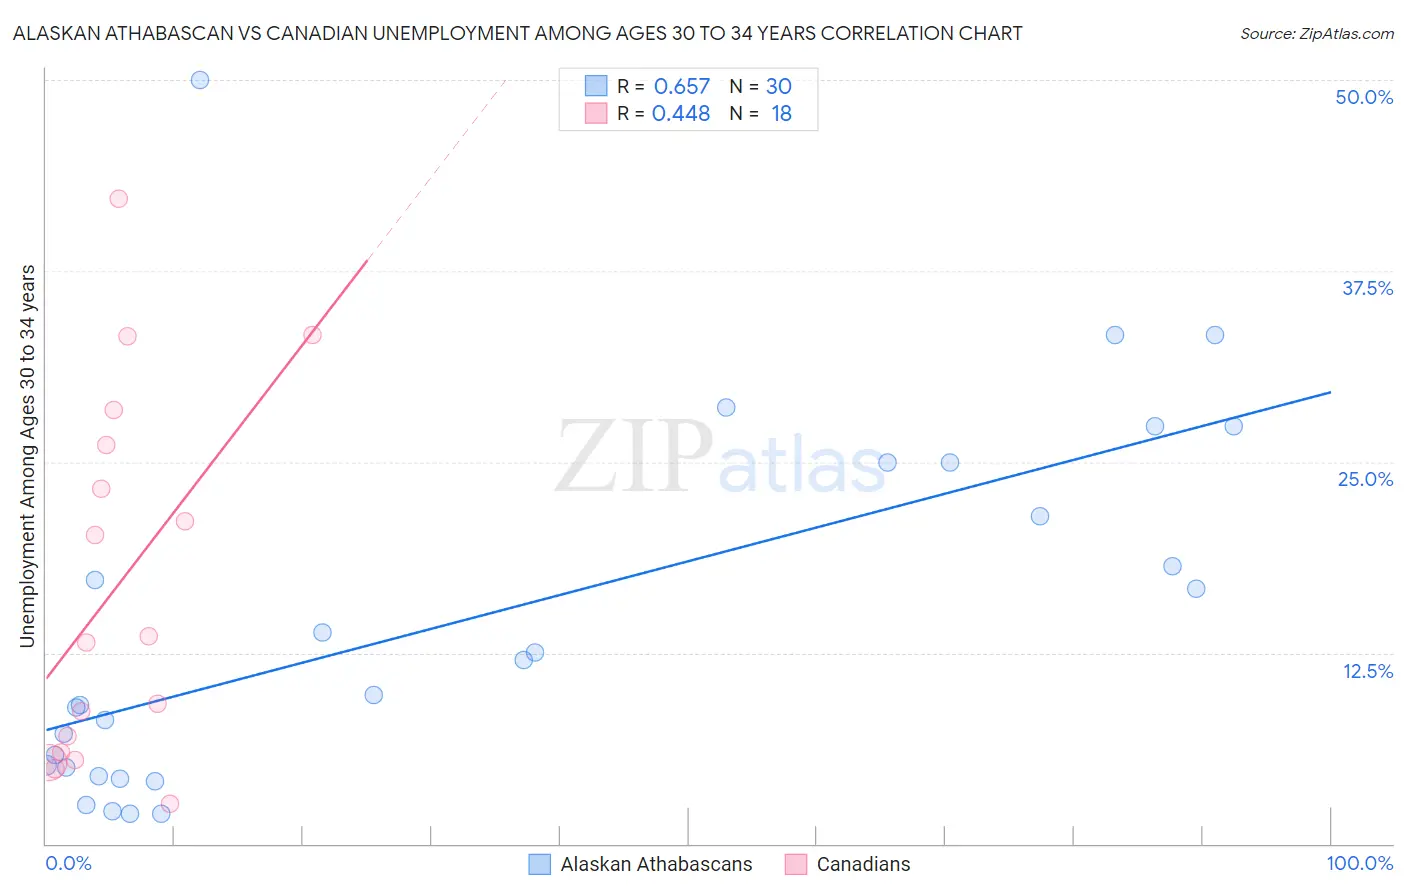
Alaskan Athabascan vs Canadian Unemployment Among Ages 30 to 34 years Correlation Chart
The statistical analysis conducted on geographies consisting of 45,103,886 people shows a significant positive correlation between the proportion of Alaskan Athabascans and unemployment rate among population between the ages 30 and 34 in the United States with a correlation coefficient (R) of 0.657 and weighted average of 7.0%. Similarly, the statistical analysis conducted on geographies consisting of 404,101,488 people shows a moderate positive correlation between the proportion of Canadians and unemployment rate among population between the ages 30 and 34 in the United States with a correlation coefficient (R) of 0.448 and weighted average of 5.5%, a difference of 27.7%.
Unemployment Among Ages 30 to 34 years Correlation Summary
| Measurement | Alaskan Athabascan | Canadian |
| Minimum | 1.9% | 2.6% |
| Maximum | 50.0% | 42.2% |
| Range | 48.1% | 39.6% |
| Mean | 14.7% | 16.9% |
| Median | 10.8% | 13.4% |
| Interquartile 25% (IQ1) | 5.0% | 6.0% |
| Interquartile 75% (IQ3) | 25.0% | 26.1% |
| Interquartile Range (IQR) | 20.0% | 20.2% |
| Standard Deviation (Sample) | 12.0% | 12.0% |
| Standard Deviation (Population) | 11.8% | 11.7% |
Similar Demographics by Unemployment Among Ages 30 to 34 years
Demographics Similar to Alaskan Athabascans by Unemployment Among Ages 30 to 34 years
In terms of unemployment among ages 30 to 34 years, the demographic groups most similar to Alaskan Athabascans are British West Indian (7.0%, a difference of 0.070%), Ute (7.0%, a difference of 0.12%), Lumbee (7.1%, a difference of 0.33%), Aleut (7.1%, a difference of 0.69%), and Immigrants from St. Vincent and the Grenadines (7.0%, a difference of 1.1%).
| Demographics | Rating | Rank | Unemployment Among Ages 30 to 34 years |
| Kiowa | 0.0 /100 | #304 | Tragic 6.7% |
| Paiute | 0.0 /100 | #305 | Tragic 6.7% |
| Immigrants | Armenia | 0.0 /100 | #306 | Tragic 6.8% |
| Immigrants | Belize | 0.0 /100 | #307 | Tragic 6.9% |
| Immigrants | Azores | 0.0 /100 | #308 | Tragic 6.9% |
| Immigrants | Grenada | 0.0 /100 | #309 | Tragic 6.9% |
| Immigrants | St. Vincent and the Grenadines | 0.0 /100 | #310 | Tragic 7.0% |
| Alaskan Athabascans | 0.0 /100 | #311 | Tragic 7.0% |
| British West Indians | 0.0 /100 | #312 | Tragic 7.0% |
| Ute | 0.0 /100 | #313 | Tragic 7.0% |
| Lumbee | 0.0 /100 | #314 | Tragic 7.1% |
| Aleuts | 0.0 /100 | #315 | Tragic 7.1% |
| Houma | 0.0 /100 | #316 | Tragic 7.2% |
| Immigrants | Cabo Verde | 0.0 /100 | #317 | Tragic 7.2% |
| Blacks/African Americans | 0.0 /100 | #318 | Tragic 7.2% |
Demographics Similar to Canadians by Unemployment Among Ages 30 to 34 years
In terms of unemployment among ages 30 to 34 years, the demographic groups most similar to Canadians are Immigrants from Western Asia (5.5%, a difference of 0.0%), Immigrants from Western Europe (5.5%, a difference of 0.070%), Immigrants from Norway (5.5%, a difference of 0.16%), Immigrants from England (5.5%, a difference of 0.19%), and Malaysian (5.5%, a difference of 0.25%).
| Demographics | Rating | Rank | Unemployment Among Ages 30 to 34 years |
| Costa Ricans | 46.7 /100 | #179 | Average 5.5% |
| Italians | 45.5 /100 | #180 | Average 5.5% |
| Immigrants | Lebanon | 43.5 /100 | #181 | Average 5.5% |
| Immigrants | Denmark | 43.4 /100 | #182 | Average 5.5% |
| Hungarians | 43.1 /100 | #183 | Average 5.5% |
| Malaysians | 41.8 /100 | #184 | Average 5.5% |
| Immigrants | Western Europe | 39.1 /100 | #185 | Fair 5.5% |
| Canadians | 38.2 /100 | #186 | Fair 5.5% |
| Immigrants | Western Asia | 38.2 /100 | #187 | Fair 5.5% |
| Immigrants | Norway | 36.1 /100 | #188 | Fair 5.5% |
| Immigrants | England | 35.7 /100 | #189 | Fair 5.5% |
| Immigrants | Kazakhstan | 33.9 /100 | #190 | Fair 5.5% |
| Irish | 31.3 /100 | #191 | Fair 5.5% |
| Moroccans | 31.2 /100 | #192 | Fair 5.5% |
| Immigrants | Africa | 31.0 /100 | #193 | Fair 5.5% |